背景
bgcolor
()
函数可更改脚本的背景颜色。如果脚本在overlay = true模式下运行,则它将为图表的背景着色。
该函数的签名是:
bgcolor(color, offset, editable, show_last, title, force_overlay) → void其color参数允许使用“系列颜色”作为其参数,因此可以在表达式中动态计算。
如果正确的透明度不是要使用的颜色的一部分,则可以使用 color.new() 函数来生成。
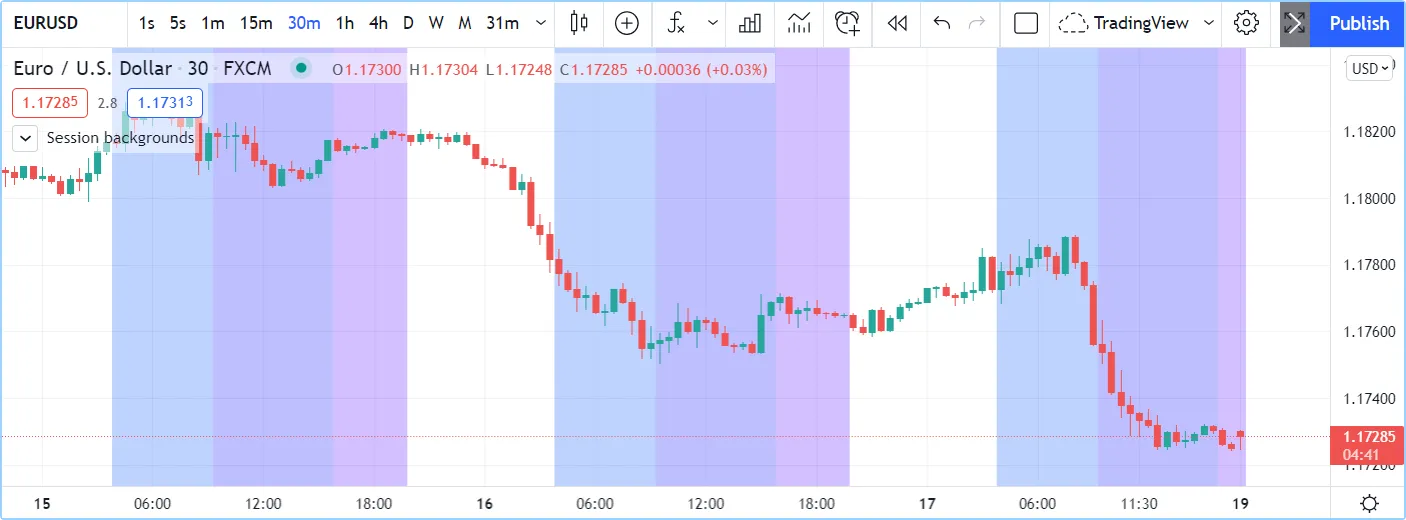
这是一个为交易时段的背景着色的脚本(例如,尝试在 30 分钟的 EURUSD 上进行):
//@version=5
indicator("Session backgrounds", overlay = true)

// Default color constants using tranparency of 25.
BLUE_COLOR   = #0050FF40
PURPLE_COLOR = #0000FF40
PINK_COLOR   = #5000FF40
NO_COLOR     = color(na)

// Allow user to change the colors.
preMarketColor  = input.color(BLUE_COLOR, "Pre-market")
regSessionColor = input.color(PURPLE_COLOR, "Pre-market")
postMarketColor = input.color(PINK_COLOR, "Pre-market")

// Function returns `true` when the bar's time is
timeInRange(tf, session) =>
    time(tf, session) != 0

// Function prints a message at the bottom-right of the chart.
f_print(_text) =>
    var table _t = table.new(position.bottom_right, 1, 1)
    table.cell(_t, 0, 0, _text, bgcolor = color.yellow)

var chartIs30MinOrLess = timeframe.isseconds or (timeframe.isintraday and timeframe.multiplier <=30)
sessionColor = if chartIs30MinOrLess
    switch
        timeInRange(timeframe.period, "0400-0930") => preMarketColor
        timeInRange(timeframe.period, "0930-1600") => regSessionColor
        timeInRange(timeframe.period, "1600-2000") => postMarketColor
        => NO_COLOR
else
    f_print("No background is displayed.\nChart timeframe must be <= 30min.")
    NO_COLOR

bgcolor(sessionColor)
注意:
- 该脚本仅适用于 30 分钟或更短的图表时间范围。当图表时间范围高于 30 分钟时,它会显示错误消息。
- 当
由于图表的时间范围不正确而使用if
结构的
else分支时,本地块将返回颜色,NO_COLOR因此在这种情况下不显示背景。 - 我们首先使用基色初始化常量,其中包括
40末尾的十六进制表示的透明度。透明度的反转 00-FF 刻度上十六进制表示的 40 对应于 Pine Script™ 的透明度 0-100 十进制刻度中的 75。 - 我们提供颜色输入,允许脚本用户更改我们建议的默认颜色。
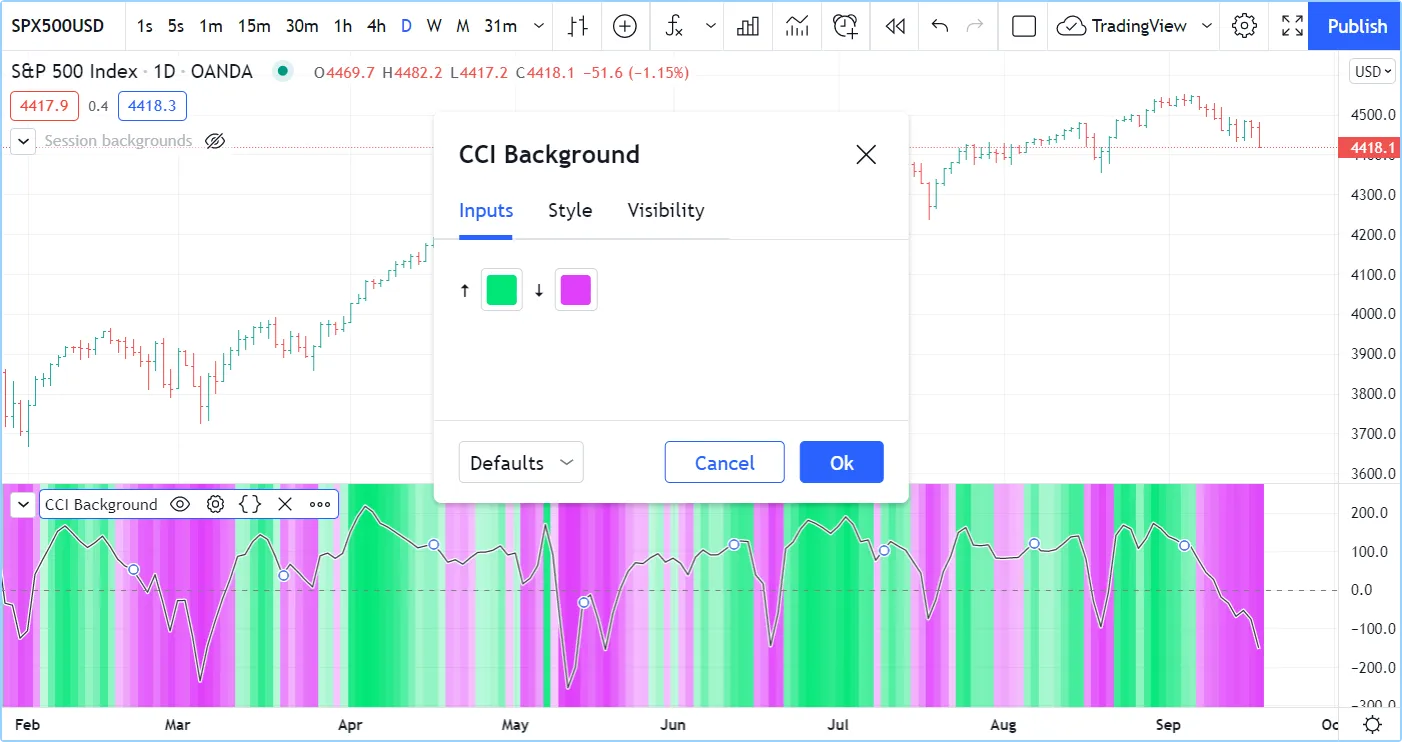
在下一个例子中,我们为 CCI 线的背景生成渐变:
//@version=5
indicator("CCI Background")

bullColor = input.color(color.lime, "🠅", inline = "1")
bearColor = input.color(color.fuchsia, "🠇", inline = "1")

// Calculate CCI.
myCCI = ta.cci(hlc3, 20)
// Get relative position of CCI in last 100 bars, on a 0-100% scale.
myCCIPosition = ta.percentrank(myCCI, 100)
// Generate a bull gradient when position is 50-100%, bear gradient when position is 0-50%.
backgroundColor = if myCCIPosition >= 50
    color.from_gradient(myCCIPosition, 50, 100, color.new(bullColor, 75), bullColor)
else
    color.from_gradient(myCCIPosition, 0, 50, bearColor, color.new(bearColor, 75))

// Wider white line background.
plot(myCCI, "CCI", color.white, 3)
// Think black line.
plot(myCCI, "CCI", color.black, 1)
// Zero level.
hline(0)
// Gradient background.
bgcolor(backgroundColor)
注意:
- 我们使用 ta.cci() 内置函数来计算指标值。
- 我们使用
ta.percentrank()
内置函数来计算,即过去 100 个条形图中低于当前值的
myCCIPosition过去值的百分比。myCCImyCCI - 为了计算梯度,我们使用了两个不同的
color.from_gradient()
内置函数调用:一个用于
myCCIPosition在 50-100% 范围内的牛市梯度,这意味着更多的过去值低于其当前值;另一个用于在myCCIPosition0-49.99% 范围内的熊市梯度,这意味着更多的过去值高于它。 - 我们提供输入,以便用户可以更改牛市/熊市的颜色,并且我们将两个颜色输入小部件放在同一行上,并
inline = "1"在两个 input.color() 调用中使用。 - 我们使用两个plot()调用来绘制 CCI 信号 ,以在繁忙的背景上实现最佳对比度:第一个图是 3 像素宽的白色背景,第二个 plot() 调用绘制细的 1 像素宽的黑线。
请参阅颜色页面以获取更多背景示例。