线条和盒子
介绍
Pine Script™ 可使用线、框和折线类型从代码中绘制线、框和其他几何图形 。这些类型 可用于 以编程方式在图表上绘制支撑位和阻力位、趋势线、价格范围和其他自定义图形。
与绘图不同,这些类型的灵活性使它们特别适合在图表上几乎任何可用点可视化当前计算的数据,而不管脚本在哪个图表栏上执行。
线、 框和 折线 都是对象,就像 标签、 表格和其他特殊类型一样。脚本使用 ID 引用这些类型的对象,这些 ID 的作用类似于指针。与其他对象一样, 线、 框和 折线 ID 被限定为“系列”值,并且管理这些对象的所有函数都接受“系列”参数。
脚本绘制的线条可以是垂直的、水平的或有角度的。方框始终是矩形。折线依次连接多个垂直、水平、有角度或弯曲的线段。尽管所有这些绘图类型都有不同的特点,但它们确实有一些共同点:
- 线、 框和 折线可以在图表上的任何可用位置具有坐标,包括最后一个图表条之后的未来时间的坐标。
- 这些类型的对象可以使用 chart.point 实例来设置其坐标。
- 每个对象的 x 坐标可以是条形索引或时间值,具体取决于其指定的
xloc属性。 - 每个对象可以具有多个预定义线条样式之一。
- 脚本可以在循环和 条件结构范围内调用管理这些对象的函数,从而可以对其绘图进行迭代和条件控制。
- 脚本可以引用和显示在图表上的这些对象的数量是有限制的。单个脚本实例最多可以显示 500 条线、500 个框和 100 条折线。用户可以通过
脚本的
indicator()
或
strategies()
max_lines_count声明语句的、max_boxes_count和参数指定每种类型允许的最大数量 。如果未指定,则默认值为 ~50。与 标签 和 表格 类型一样,线、框和折线使用垃圾收集 机制,当绘图总数超过脚本的限制时,该机制会删除图表上最旧的对象。max_polylines_count
线条
命名空间中的内置函数控制线line.*对象的创建和管理
:
- line.new () 函数创建一个新行。
- 该
line.set_*()函数修改线条属性。 - 该
line.get_*()函数从线实例中检索值。 - line.copy () 函数克隆一个线实例。
- line.delete () 函数删除现有的线实例。
- line.all
变量
引用一个只读
数组,
其中包含脚本显示的所有线的 ID。数组的
大小
取决于
max_lines_countindicator () 或 strategies() 声明语句以及脚本绘制的线数。
脚本可以将、、
line.set_*()line.copy ()和
line.delete()
内置函数作为函数或方法调用。line.get_*()
创建线
line.new () 函数创建一个新的 线 实例以显示在图表上。它具有以下签名:
line.new(first_point, second_point, xloc, extend, color, style, width, force_overlay) → series line
line.new(x1, y1, x2, y2, xloc, extend, color, style, width, force_overlay) → series line此函数的第一个重载包含first_point和
second_point参数。first_point是一个
chart.point
,表示线条的起点, 是second_point一个
chart.point ,表示线条的终点。该函数从这些图表点
复制信息
以确定线条的坐标。它是否使用和
中的index或字段作为 x 坐标取决于函数的值。timefirst_pointsecond_pointxloc
第二个重载分别指定x1、y1、x2和y2值,其中x1和x2是
int
值,表示线条的起始和终止 x 坐标,和y1是y2浮点
值
,表示 y 坐标。线条是否将
x值视为条形索引或时间戳取决于xloc函数调用中的值。
两个重载共享相同的附加参数:
xloc
xloc的值
告诉函数使用
和的字段,而xloc.bar_time的值
告诉函数使用点的字段。indexfirst_pointsecond_pointtime
xloc的值
会提示函数将和参数视为条形索引值。使用
xloc.bar_time时,函数会将和视为时间值。x1x2x1x2
bar_index - 9999。对于更大的偏移量,可以使用
xloc.bar_time。
extend
color
style
width
force_overlay
true,绘图将显示在主图表窗格中,即使脚本占用单独的窗格也是如此。可选。默认值为false。
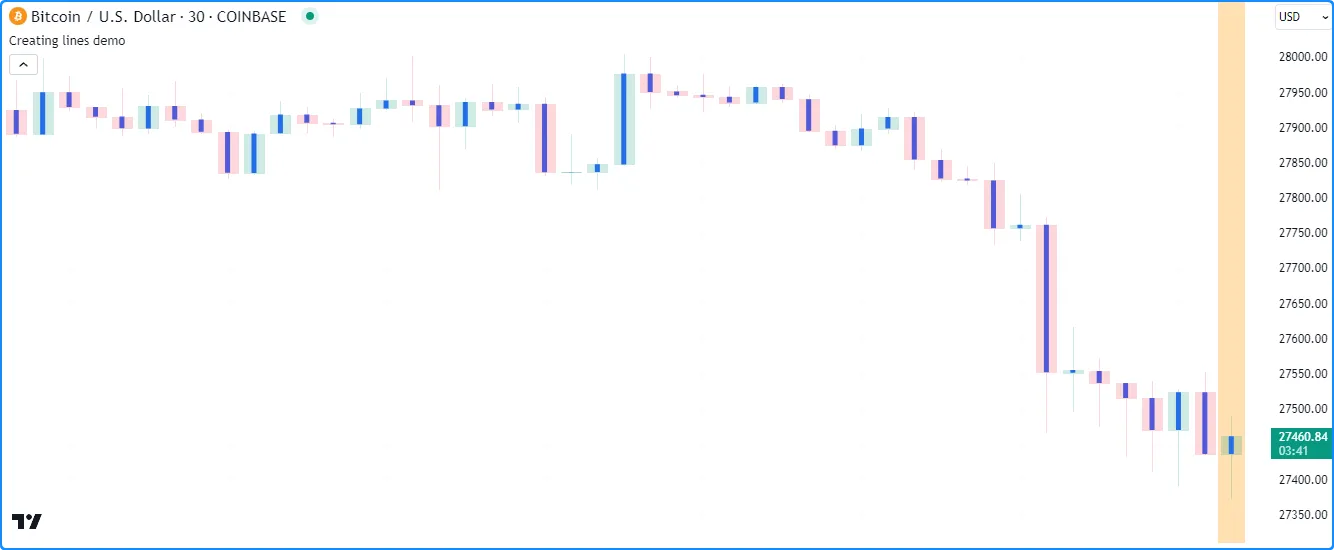
下面的示例演示了如何以最简单的形式绘制线条。此脚本 在每个图表条的水平中心绘制一条连接开盘价 和 收盘价的新垂直线:
//@version=5
indicator("Creating lines demo", overlay = true)

//@variable The `chart.point` for the start of the line. Contains `index` and `time` information.
firstPoint = chart.point.now(open)
//@variable The `chart.point` for the end of the line. Contains `index` and `time` information.
secondPoint = chart.point.now(close)

// Draw a basic line with a `width` of 5 connecting the `firstPoint` to the `secondPoint`.
// This line uses the `index` field from each point for its x-coordinates.
line.new(firstPoint, secondPoint, width = 5)

// Color the background on the unconfirmed bar.
bgcolor(barstate.isconfirmed ? na : color.new(color.orange, 70), title = "Unconfirmed bar highlight")
注意:
- 如果
firstPoint和secondPoint引用相同的坐标,则脚本将不会显示线,因为它们之间没有要绘制的距离。但是,线 ID 仍然存在。 - 该脚本将仅显示图表上大约最后 50 条线,因为它未
max_lines_count在 indicator() 函数调用中指定。线条图将保留在图表上,直到使用 line.delete()删除 或被垃圾收集器移除。 - 脚本会在打开的图表条(即具有橙色背景突出显示的条)上重新绘制线条,直到关闭。 条关闭后,它将不再更新绘图。
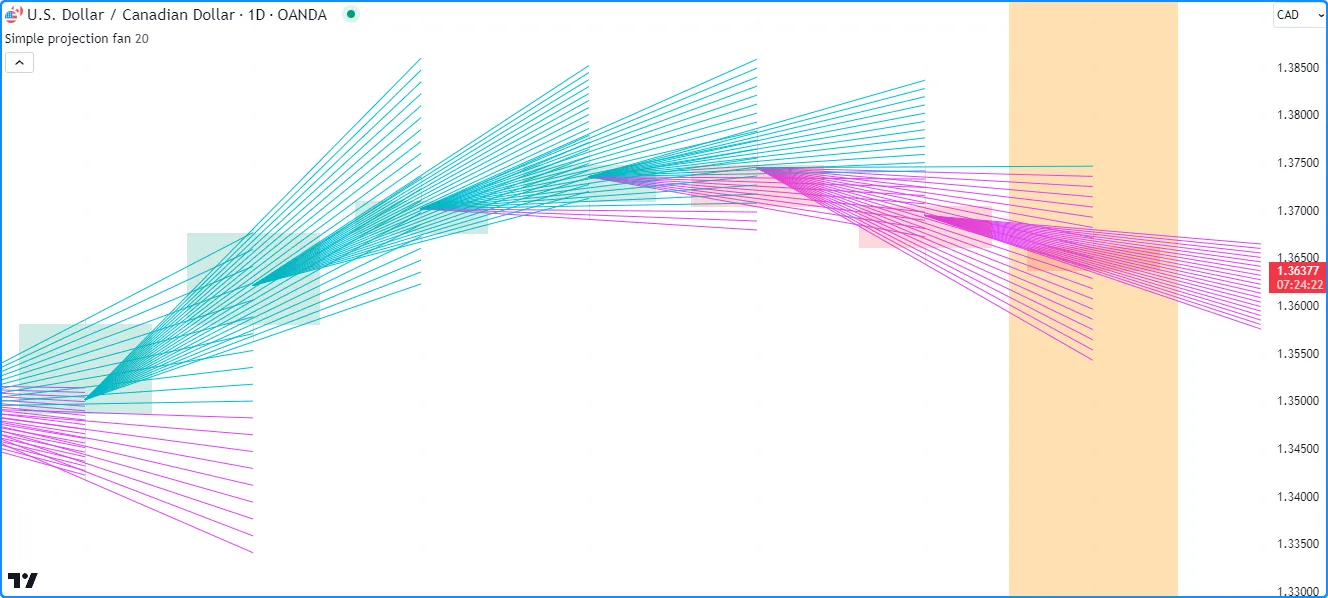
让我们看一个更复杂的例子。此脚本使用前一个条形图的
hl2
价格和当前条形图的
最高价
和最低价
来绘制一个扇形图,该扇形图具有用户指定的线条数,投射出以下图表条形图的一系列假设价格值。它
在for循环中调用line.new()在每个条形图上创建线条:linesPerBar
//@version=5
indicator("Creating lines demo", "Simple projection fan", true, max_lines_count = 500)

//@variable The number of fan lines drawn on each chart bar.
int linesPerBar = input.int(20, "Line drawings per bar", 2, 100)

//@variable The distance between each y point on the current bar.
float step = (high - low) / (linesPerBar - 1)

//@variable The `chart.point` for the start of each line. Does not contain `time` information.
firstPoint = chart.point.from_index(bar_index - 1, hl2[1])
//@variable The `chart.point` for the end of each line. Does not contain `time` information.
secondPoint = chart.point.from_index(bar_index + 1, float(na))

//@variable The stepped y value on the current bar for `secondPoint.price` calculation, starting from the `low`.
float barValue = low
// Loop to draw the fan.
for i = 1 to linesPerBar
    // Update the `price` of the `secondPoint` using the difference between the `barValue` and `firstPoint.price`.
    secondPoint.price := 2.0 * barValue - firstPoint.price
    //@variable Is `color.aqua` when the line's slope is positive, `color.fuchsia` otherwise.
    color lineColor = secondPoint.price > firstPoint.price ? color.aqua : color.fuchsia
    // Draw a new `lineColor` line connecting the `firstPoint` and `secondPoint` coordinates.
    // This line uses the `index` field from each point for its x-coordinates.
    line.new(firstPoint, secondPoint, color = lineColor)
    // Add the `step` to the `barValue`.
    barValue += step

// Color the background on the unconfirmed bar.
bgcolor(barstate.isconfirmed ? na : color.new(color.orange, 70), title = "Unconfirmed bar highlight")
注意:
- 我们已经将其纳入了
max_lines_count = 500indicator () 函数调用,这意味着脚本在图表上保留最多 500 条线。 - 每次
line.new()
调用都会从和变量
引用的chart.point中复制信息
。因此,脚本可以在每次循环迭代中更改的字段
,而不会影响其他线中的 y 坐标。
firstPointsecondPointpricesecondPoint
修改线条
命名空间line.*包含多个修改
线实例属性的setter函数
:
- line.set_first_point()
和
line.set_second_point()
id分别使用来自指定的信息 更新线的起点和终点point。 - line.set_x1()
和
line.set_x2()将线
的 x 坐标之一设置
id为新x值,该新值可以表示取决于线的属性的条形索引或时间值xloc。 - line.set_y1()
和
line.set_y2()将线
的 y 坐标之一设置
id为新y值。 - line.set_xy1()
和
line.set_xy2()使用新的值更新
id线的 某个点。xy - line.set_xloc()
设置线
xloc的并用新的和值id更新其 x 坐标。x1x2 - line.set_extend()
设置线
extend的属性id。 - line.set_color()
更新
id线的color值。 - line.set_style()
改变线条
style的风格id。 - line.set_width()
设置线
width的宽度id。
所有 setter 函数都直接修改id传入调用的行,不返回任何值。每个 setter 函数都接受“系列”参数,因为脚本可以在执行过程中更改行的属性。
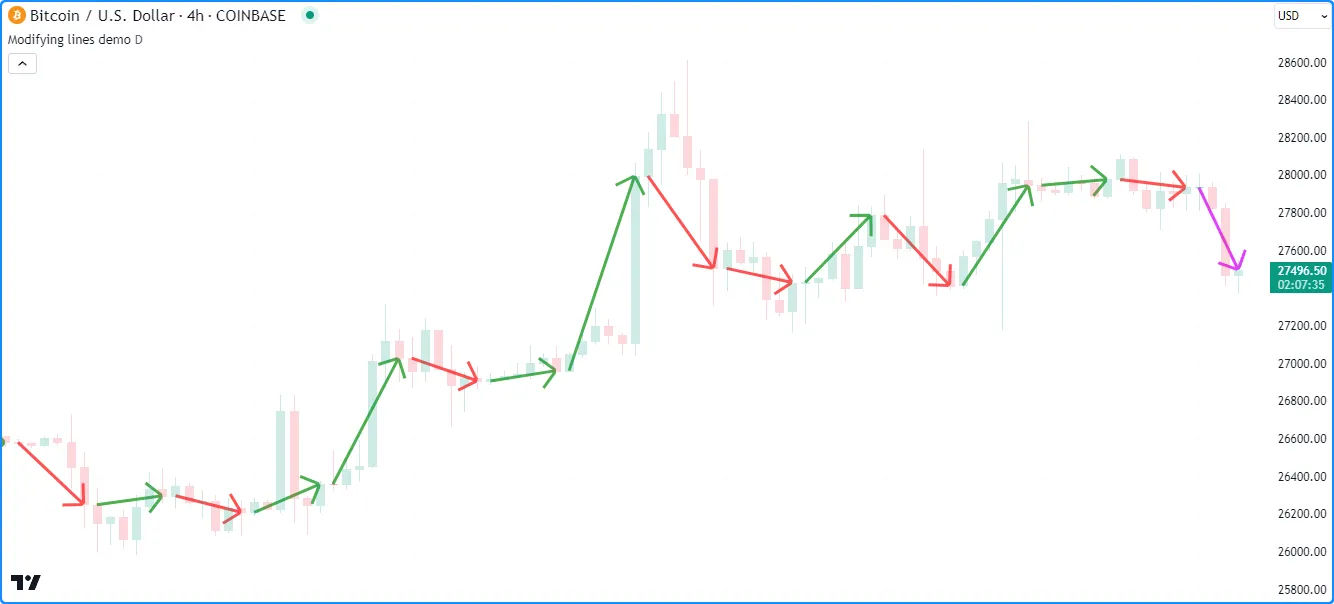
以下示例绘制了连接 a 的开盘价
timeframe和收盘价的线条。脚本使用
var
关键字声明periodLine和 变量,这些变量
仅在第一个图表条上引用chart.point
值(openPoint和closePoint),并在执行过程中为这些变量分配新值。在检测到 上
的变化后,它
使用
line.set_color()设置现有的,使用
chart.point.now()为和创建新值,然后
使用这些点为分配一条新线。timeframecolorperiodLineopenPointclosePointperiodLine
periodLine在值不是
na 的其他条形图上,脚本会为 分配一个新的
chart.point ,closePoint然后使用
line.set_second_point()
和
line.set_color()
作为方法来更新线条的属性:
//@version=5
indicator("Modifying lines demo", overlay = true)

//@variable The size of each period.
string timeframe = input.timeframe("D", "Timeframe")

//@variable A line connecting the period's opening and closing prices.
var line periodLine = na

//@variable The first point of the line. Contains `time` and `index` information.
var chart.point openPoint = chart.point.now(open)
//@variable The closing point of the line. Contains `time` and `index` information.
var chart.point closePoint = chart.point.now(close)

if timeframe.change(timeframe)
    //@variable The final color of the `periodLine`.
    color finalColor = switch
        closePoint.price > openPoint.price => color.green
        closePoint.price < openPoint.price => color.red
        =>                                    color.gray

    // Update the color of the current `periodLine` to the `finalColor`.
    line.set_color(periodLine, finalColor)

    // Assign new points to the `openPoint` and `closePoint`.
    openPoint  := chart.point.now(open)
    closePoint := chart.point.now(close)
    // Assign a new line to the `periodLine`. Uses `time` fields from the `openPoint` and `closePoint` as x-coordinates.
    periodLine := line.new(openPoint, closePoint, xloc.bar_time, style = line.style_arrow_right, width = 3)

else if not na(periodLine)
    // Assign a new point to the `closePoint`.
    closePoint := chart.point.now(close)

    //@variable The color of the developing `periodLine`.
    color developingColor = switch
        closePoint.price > openPoint.price => color.aqua
        closePoint.price < openPoint.price => color.fuchsia
        =>                                    color.gray

    // Update the coordinates of the line's second point using the new `closePoint`.
    // It uses the `time` field from the point for its new x-coordinate.
    periodLine.set_second_point(closePoint)
    // Update the color of the line using the `developingColor`.
    periodLine.set_color(developingColor)
注意:
- 本示例中的每条线条图均使用 line.style_arrow_right 样式。请参阅 下面的线条样式部分,了解所有可用样式设置的概述。
线条样式
用户可以通过在line.new()
或
line.set_style()
函数调用style中
传递以下变量之一作为参数来控制脚本线条图的样式:
| 争论 | 线 |
|---|---|
line.style_solid |  |
line.style_dotted |  |
line.style_dashed |  |
line.style_arrow_left | |
line.style_arrow_right | |
line.style_arrow_both |
注意:
- 折线也可以使用这些变量中的任何一个作为其
line_style值。请参阅 本页的创建折线部分。
读取线值
命名line.*空间包含getter函数,允许脚本从
线
对象中检索值以供进一步使用:
- line.get_x1()
和
line.get_x2()
分别获取线条的第一和第二个 x 坐标
id。返回的值是否表示条形索引或时间值取决于线条的xloc属性。 - line.get_y1()
和
line.get_y2()
分别获取
id线的第一个和第二个 y 坐标。 - line.get_price()
id检索指定值处的 线的价格(y 坐标)x,包括线起点和终点之外的条形索引。此函数仅与使用 xloc.bar_index 作为xloc值的线兼容。
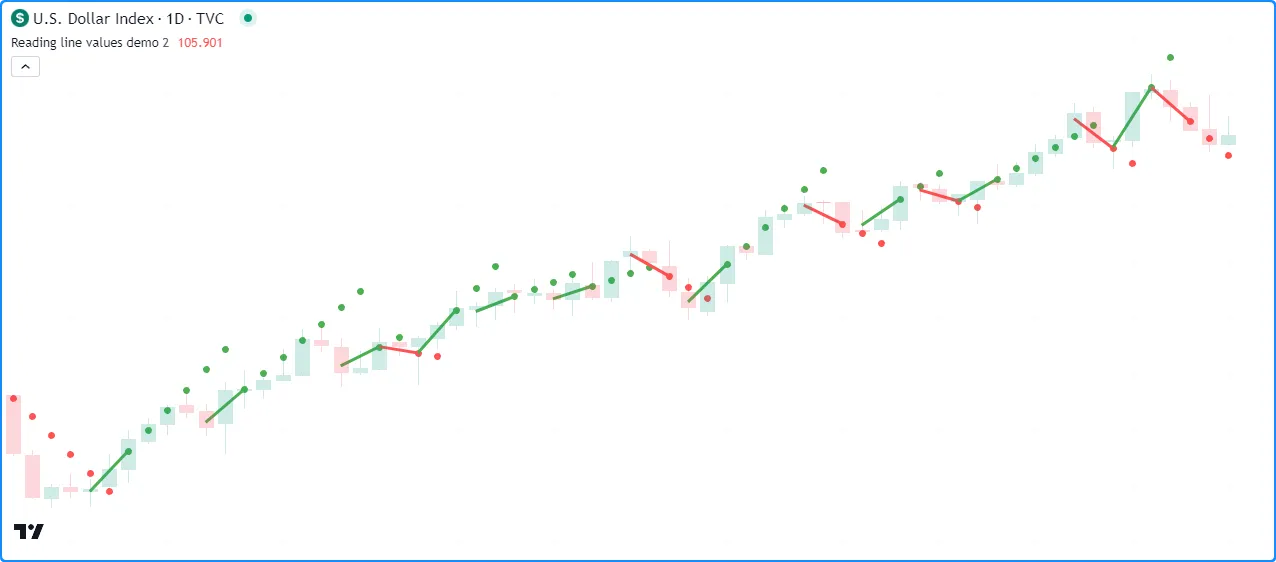
下面的脚本在
价格上涨
或
下跌的
形态开始形成时绘制一条新线length。它使用
var
关键字在第一个图表条上声明directionLine变量。分配给的 ID 将directionLine在后续条上持续存在,直到newDirection条件发生,在这种情况下,脚本将为变量分配一条新线。
在每个柱状图上,脚本调用
line.get_y2()、
line.get_y1()、
line.get_x2()和
line.get_x1()
getter 作为方法来从当前检索值directionLine并计算其
值,并使用该值确定每个绘图和图的颜色。它使用line.get_price()从其第二个点
以外slope检索扩展值,
并将它们绘制在图表上:directionLine
//@version=5
indicator("Reading line values demo", overlay = true)

//@variable The number of bars for rising and falling calculations.
int length = input.int(2, "Length", 2)

//@variable A line that's drawn whenever `hlc3` starts rising or falling over `length` bars.
var line directionLine = na

//@variable Is `true` when `hlc3` is rising over `length` bars, `false` otherwise.
bool rising = ta.rising(hlc3, length)
//@variable Is `true` when `hlc3` is falling over `length` bars, `false` otherwise.
bool falling = ta.falling(hlc3, length)
//@variable Is `true` when a rising or falling pattern begins, `false` otherwise.
bool newDirection = (rising and not rising[1]) or (falling and not falling[1])

// Update the `directionLine` when `newDirection` is `true`. The line uses the default `xloc.bar_index`.
if newDirection
    directionLine := line.new(bar_index - length, hlc3[length], bar_index, hlc3, width = 3)

//@variable The slope of the `directionLine`.
float slope = (directionLine.get_y2() - directionLine.get_y1()) / (directionLine.get_x2() - directionLine.get_x1())
//@variable The value extrapolated from the `directionLine` at the `bar_index`.
float lineValue = line.get_price(directionLine, bar_index)

//@variable Is `color.green` when the `slope` is positive, `color.red` otherwise.
color slopeColor = slope > 0 ? color.green : color.red

// Update the color of the `directionLine`.
directionLine.set_color(slopeColor)
// Plot the `lineValue`.
plot(lineValue, "Extrapolated value", slopeColor, 3, plot.style_circles)
注意:
- 此示例调用line.new()函数的第二个重载
,该重载使用
x1、y1、x2和y2参数来定义线的起点和终点。x1值为length当前 bar_index后面的条数,y1值为 该索引处的hlc3x2值。函数调用中的和y2使用当前条数的 bar_index 和 hlc3 值。 - line.get_price
()
函数调用将其
directionLine视为无限延伸,而不管其extend属性如何。 - 该脚本仅显示图表上的大约最后 50 行,但 推断值的图 涵盖了整个图表的历史记录。
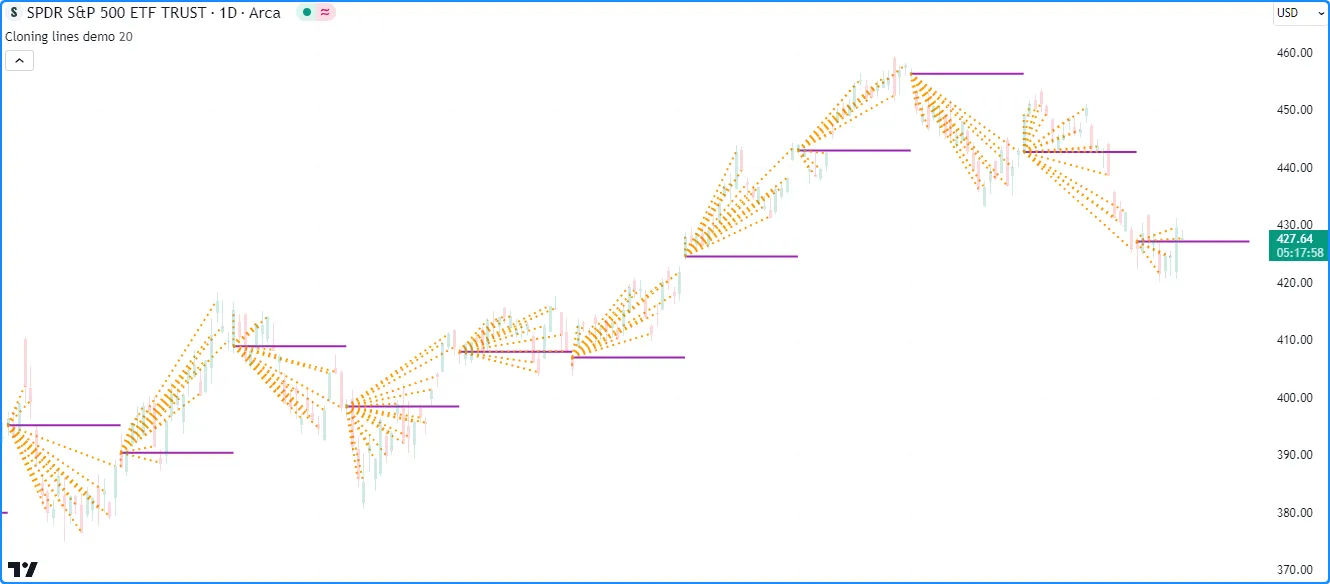
克隆线
脚本可以使用line.copy()id函数克隆一条线及其所有属性
。对复制的线实例的任何更改都不会影响原始线实例。
例如,此脚本每条柱形图在柱形图的开盘价处创建一条水平线
length,并将其分配给一个mainLine
变量。在所有其他柱形图上,它copiedLine使用
line.copy()创建一条
并调用line.set_*()函数来
修改其属性。如下所示,更改copiedLine
不会mainLine以任何方式影响:
//@version=5
indicator("Cloning lines demo", overlay = true, max_lines_count = 500)

//@variable The number of bars between each new mainLine assignment.
int length = input.int(20, "Length", 2, 500)

//@variable The first `chart.point` used by the `mainLine`. Contains `index` and `time` information.
firstPoint = chart.point.now(open)
//@variable The second `chart.point` used by the `mainLine`. Does not contain `time` information.
secondPoint = chart.point.from_index(bar_index + length, open)

//@variable A horizontal line drawn at the `open` price once every `length` bars.
var line mainLine = na

if bar_index % length == 0
    // Assign a new line to the `mainLine` that connects the `firstPoint` to the `secondPoint`.
    // This line uses the `index` fields from both points as x-coordinates.
    mainLine := line.new(firstPoint, secondPoint, color = color.purple, width = 2)

//@variable A copy of the `mainLine`. Changes to this line do not affect the original.
line copiedLine = line.copy(mainLine)

// Update the color, style, and second point of the `copiedLine`.
line.set_color(copiedLine, color.orange)
line.set_style(copiedLine, line.style_dotted)
line.set_second_point(copiedLine, chart.point.now(close))
注意:
index的字段是secondPoint超出length当前 bar_index的条数。由于xloc.bar_index允许的最大 x 坐标 为bar_index + 500,我们将输入maxval的设置length为 500。
删除行
id要删除脚本绘制的
线条,请使用line.delete()
函数。此函数会从脚本中删除线条实例,并将其绘制在图表上。
当人们只想在给定时间内保留图表上的特定数量的线条,或者在图表进展过程中有条件地删除绘图时,删除线条实例通常很方便。
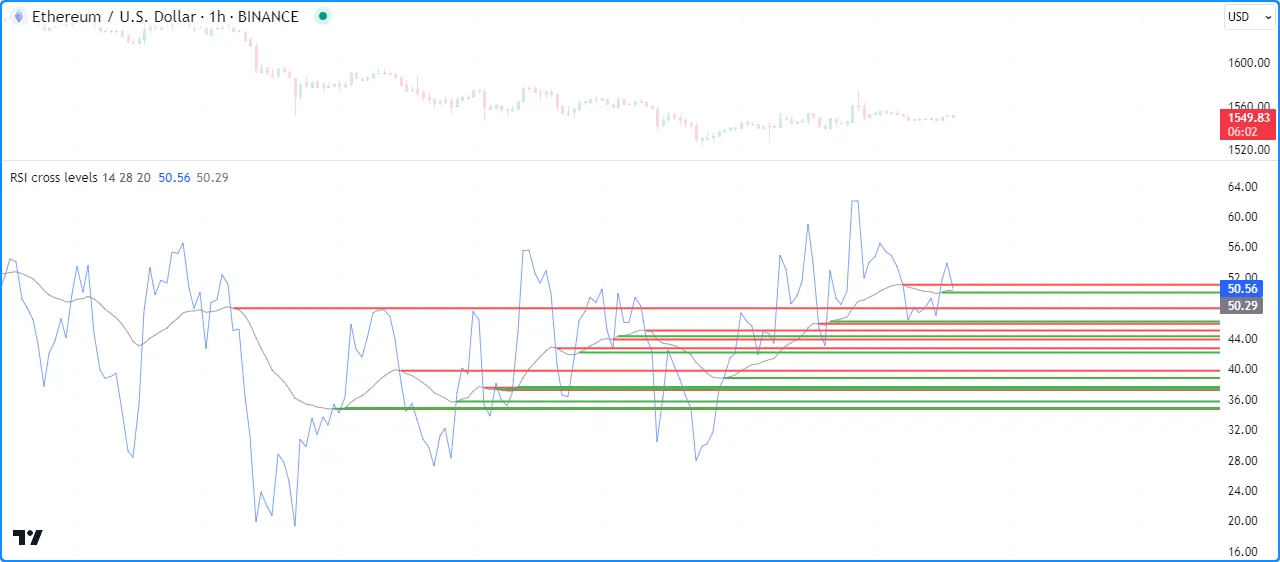
例如,每当 RSI 穿过其 EMA时,此脚本就会使用extend.right属性绘制一条水平线 。
脚本将所有线路 ID 存储在一个lines数组
中,并用作队列,numberOfLines以便仅显示图表上的
最后一个线路 ID。当数组
的
大小
超过指定的值时,脚本将使用
array.shift()删除数组中最旧的线路 ID,并使用line.delete()
将其删除
:numberOfLines
//@version=5

//@variable The maximum number of lines allowed on the chart.
const int MAX_LINES_COUNT = 500

indicator("Deleting lines demo", "RSI cross levels", max_lines_count = MAX_LINES_COUNT)

//@variable The length of the RSI.
int rsiLength = input.int(14, "RSI length", 2)
//@variable The length of the RSI's EMA.
int emaLength = input.int(28, "RSI average length", 2)
//@variable The maximum number of lines to keep on the chart.
int numberOfLines = input.int(20, "Lines on the chart", 0, MAX_LINES_COUNT)

//@variable An array containing the IDs of lines on the chart.
var array<line> lines = array.new<line>()

//@variable An `rsiLength` RSI of `close`.
float rsi = ta.rsi(close, rsiLength)
//@variable A `maLength` EMA of the `rsi`.
float rsiMA = ta.ema(rsi, emaLength)

if ta.cross(rsi, rsiMA)
    //@variable The color of the horizontal line.
    color lineColor = rsi > rsiMA ? color.green : color.red
    // Draw a new horizontal line. Uses the default `xloc.bar_index`.
    newLine = line.new(bar_index, rsiMA, bar_index + 1, rsiMA, extend = extend.right, color = lineColor, width = 2)
    // Push the `newLine` into the `lines` array.
    lines.push(newLine)
    // Delete the oldest line when the size of the array exceeds the specified `numberOfLines`.
    if array.size(lines) > numberOfLines
        line.delete(lines.shift())

// Plot the `rsi` and `rsiMA`.
plot(rsi, "RSI", color.new(color.blue, 40))
plot(rsiMA, "EMA of RSI", color.new(color.gray, 30))
注意:
- 我们声明了一个
MAX_LINES_COUNT具有“const int” 限定类型的变量,脚本将其用作indicator()max_lines_count函数 中的 ,并将input.int()的 分配给该变量。maxvalnumberOfLines - 此示例使用line.new()函数的第二个重载
,它独立指定
x1、y1、x2和y2坐标。
填充行与行之间的空间
脚本可以通过使用linefill.new()函数
创建
引用
两个线条图的linefill对象来填充两个线条图之间的空间
。线条填充会使用它们引用的和ID
中的属性自动确定其填充边界。line1line2
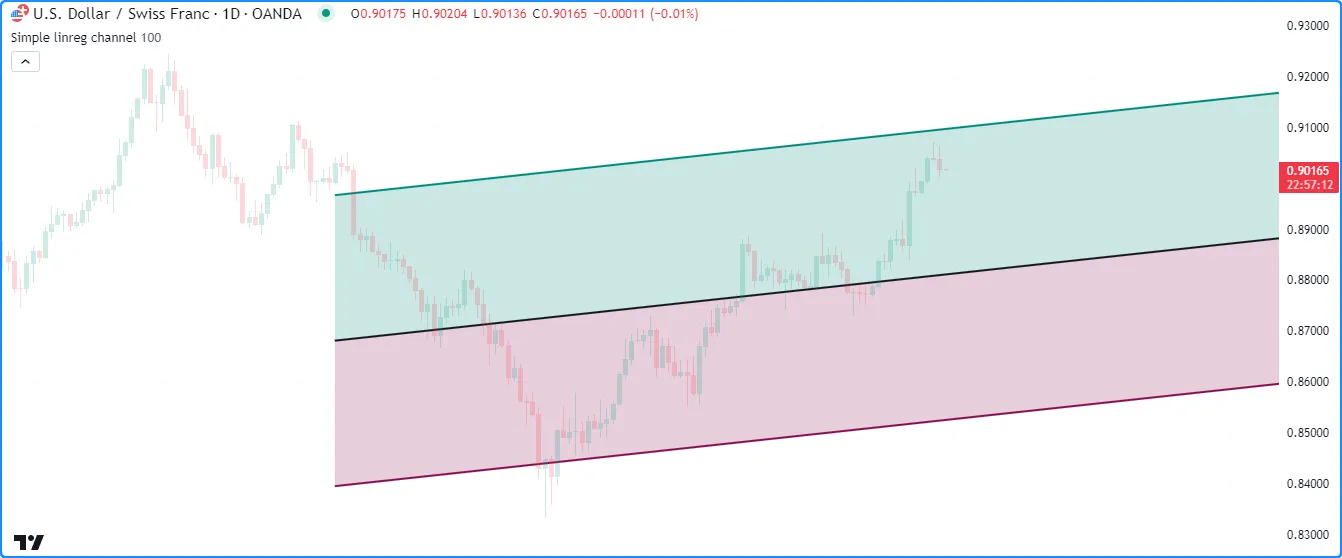
例如,此脚本计算一个简单的线性回归通道。在第一个图表条上,脚本声明basisLine、
upperLine和lowerLine变量以引用通道的
线
ID,然后进行两次
linefill.new()
调用以创建
填充通道上部和下部的 linefill 对象。第一个
linefill填充basisLine和
之间的空间,第二个 linefill 填充和upperLine之间的空间。basisLinelowerLine
脚本会更新后续条形图中线条的坐标。但是,请注意,脚本永远不需要更新第一条形图中声明的线条填充。它们会根据指定线条的坐标自动更新填充区域:
//@version=5
indicator("Filling the space between lines demo", "Simple linreg channel", true)

//@variable The number of bars in the linear regression calculation.
int lengthInput = input.int(100)

//@variable The basis line of the regression channel.
var line basisLine = line.new(na, na, na, na, extend = extend.right, color = chart.fg_color, width = 2)
//@variable The channel's upper line.
var line upperLine = line.new(na, na, na, na, extend = extend.right, color = color.teal, width = 2)
//@variable The channel's lower line.
var line lowerLine = line.new(na, na, na, na, extend = extend.right, color = color.maroon, width = 2)

//@variable A linefill instance that fills the space between the `basisLine` and `upperLine`.
var linefill upperFill = linefill.new(basisLine, upperLine, color.new(color.teal, 80))
//@variable A linefill instance that fills the space between the `basisLine` and `lowerLine`.
var linefill lowerFill = linefill.new(basisLine, lowerLine, color.new(color.maroon, 80))

// Update the `basisLine` coordinates with current linear regression values.
basisLine.set_xy1(bar_index + 1 - lengthInput, ta.linreg(close, lengthInput, lengthInput - 1))
basisLine.set_xy2(bar_index, ta.linreg(close, lengthInput, 0))

//@variable The channel's standard deviation.
float stDev = 0.0
for i = 0 to lengthInput - 1
    stDev += math.pow(close[i] - line.get_price(basisLine, bar_index - i), 2)
stDev := math.sqrt(stDev / lengthInput) * 2.0

// Update the `upperLine` and `lowerLine` using the values from the `basisLine` and the `stDev`.
upperLine.set_xy1(basisLine.get_x1(), basisLine.get_y1() + stDev)
upperLine.set_xy2(basisLine.get_x2(), basisLine.get_y2() + stDev)
lowerLine.set_xy1(basisLine.get_x1(), basisLine.get_y1() - stDev)
lowerLine.set_xy2(basisLine.get_x2(), basisLine.get_y2() - stDev)
要了解有关 线填充 类型的更多信息,请参阅填充页面的此 部分。
盒子
命名空间中的内置函数box.*创建并管理
框
对象:
- box.new () 函数创建一个新盒子。
- 该
box.set_*()函数修改盒子的属性。 - 该
box.get_*()函数从框实例中检索值。 - box.copy () 函数克隆一个盒子实例。
- box.delete () 函数删除一个盒子实例。
- box.all
变量引用一个只读
数组,
其中包含脚本显示的所有框的 ID。数组的
大小
取决于indicator
()
或
strategies()
声明语句以及脚本绘制的框数。
max_boxes_count
与线条一样,用户可以调用box.set_*()、、box.get_*()box.copy
()和
box.delete()
内置函数作为函数或方法。
创建框
box.new () 函数创建一个新的 box 对象以显示在图表上。它具有以下签名:
box.new(top_left, bottom_right, border_color, border_width, border_style, extend, xloc, bgcolor, text, text_size, text_color, text_halign, text_valign, text_wrap, text_font_family, force_overlay) → series box
box.new(left, top, right, bottom, border_color, border_width, border_style, extend, xloc, bgcolor, text, text_size, text_color, text_halign, text_valign, text_wrap, text_font_family, force_overlay) → series box此函数的第一个重载包括top_left和
bottom_right参数,它们
分别接受表示框左上角和右下角的
chart.point对象。该函数从这些图表点复制信息以设置框角的坐标。它是否使用和点的index或字段
作为 x 坐标取决于函数的值。timetop_leftbottom_rightxloc
第二个重载指定框的left、top、right和边缘。和参数接受
int
值,指定框的左侧和右侧 x 坐标,这些值可以是条形索引或时间值,具体取决于函数调用中的值。和参数接受
浮点
值,表示框的顶部和底部 y 坐标。bottomleftrightxloctopbottom
该函数的附加参数在两个重载中是相同的:
border_color
border_width
border_style
extend
xloc
xloc的值
意味着该函数将使用和图表点的字段
,而xloc.bar_time的值
意味着它将使用它们的字段。indextop_leftbottom_rightxloctime
xloc的值
意味着该函数将和值视为条形索引,而
xloc.bar_time
意味着它将它们视为时间戳。leftright
bar_index - 9999。对于更大的偏移量,可以使用
xloc.bar_time。
bgcolor
text
text_size
text_color
text_halign
text_valign
text_wrap
text_font_family
force_overlay
true,绘图将显示在主图表窗格中,即使脚本占用单独的窗格也是如此。可选。默认值为false。
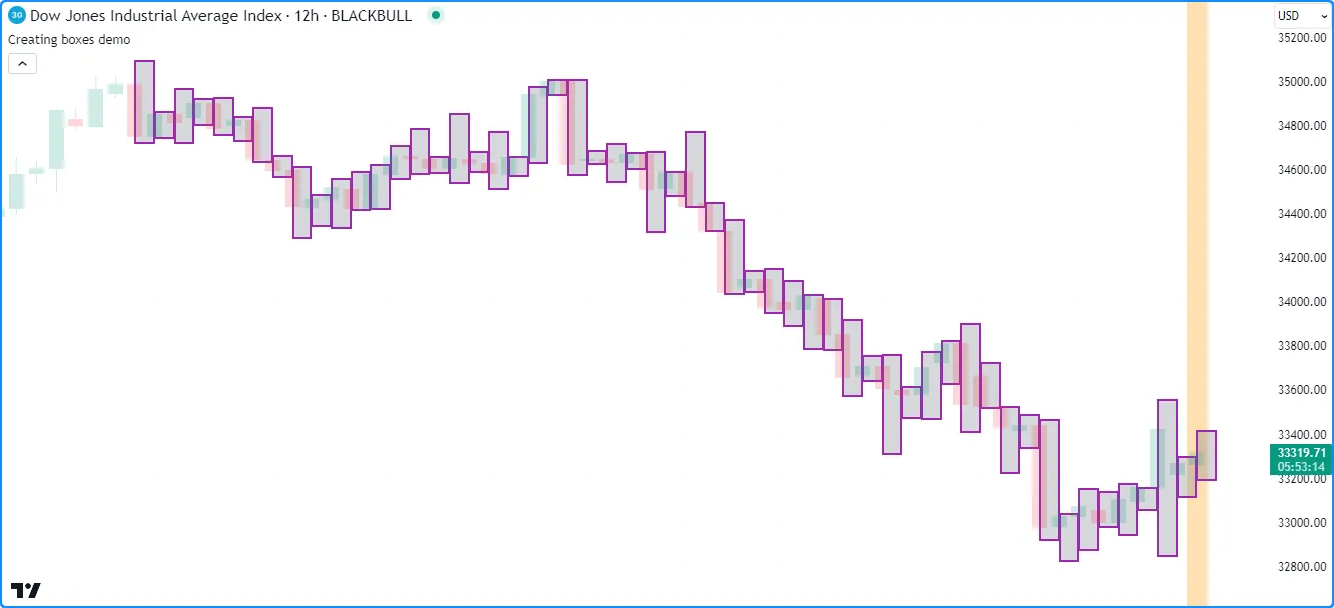
让我们编写一个简单的脚本来在图表上显示方框。下面的示例绘制了一个方框,将每个条形图的 高值 和低值 从当前条形图的水平中心投射到下一个可用条形图的中心。
在每个条形图上,脚本通过chart.point.now()
和
chart.point_from_index()topLeft创建并bottomRight指向
,然后调用
box.new()
构造一个新框并将其显示在图表上。它还使用
bgcolor()突出显示未确认的图表条形图上的背景
,以表明它会重新绘制该框,直到条形图最后一次更新:
//@version=5
indicator("Creating boxes demo", overlay = true)

//@variable The `chart.point` for the top-left corner of the box. Contains `index` and `time` information.
topLeft = chart.point.now(high)
//@variable The `chart.point` for the bottom-right corner of the box. Does not contain `time` information.
bottomRight = chart.point.from_index(bar_index + 1, low)

// Draw a box using the `topLeft` and `bottomRight` corner points. Uses the `index` fields as x-coordinates.
box.new(topLeft, bottomRight, color.purple, 2, bgcolor = color.new(color.gray, 70))

// Color the background on the unconfirmed bar.
bgcolor(barstate.isconfirmed ? na : color.new(color.orange, 70), title = "Unconfirmed bar highlight")
注意:
- 点
bottomRight的index字段比index中的大一个条topLeft。如果角的 x 坐标相等,则脚本将在每个条的水平中心绘制一条垂直线,类似于本页 创建线条部分中的示例。 - 与线类似,如果
topLeft和bottomRight包含相同的坐标,则框不会显示在图表上,因为它们之间没有可绘制的空间。但是,其 ID 仍然存在。 - 由于我们没有在indicator()
函数调用
max_boxes_count中 指定,因此该脚本仅显示图表上大约最后 50 个框。
修改盒子
命名空间中存在多个setterbox.*函数,允许脚本修改
框
对象的属性:
- box.set_top_left_point()
和
box.set_bottom_right_point()
id分别使用来自指定的信息 更新框的左上角和右下角坐标point。 - box.set_left()
和
box.set_right()将框
的左或右 x 坐标设置
id为一个新left/right值,该值可以是条形索引或时间值,具体取决于框的xloc属性。 - box.set_top()
和
box.set_bottom()将框
的顶部或底部 y 坐标设置
id为新top/bottom值。 - box.set_lefttop()
设置框的
left和top坐标id, box.set_rightbottom() 设置其right和bottom坐标。 - box.set_border_color()、
box.set_border_width()
和
box.set_border_style()
分别更新框边框的
color、width和 。styleid - box.set_extend()
extend设置盒子的 水平属性id。 - box.set_bgcolor()将框
内部空间的颜色设置
id为新的color。 - box.set_text()、
box.set_text_size()、
box.set_text_color()、
box.set_text_halign()、
box.set_text_valign()、
box.set_text_wrap()和
box.set_text_font_family()
更新
id框的文本相关属性。
与line.*命名空间中的 setter 函数一样,所有盒子 setter 都会id直接修改盒子而不返回值,并且每个 setter 函数都接受“系列”参数。
请注意,与行不同,box.*命名空间不包含用于修改框的设置函数。对于这种情况,xloc用户必须
创建一个具有所需设置的新框。xloc
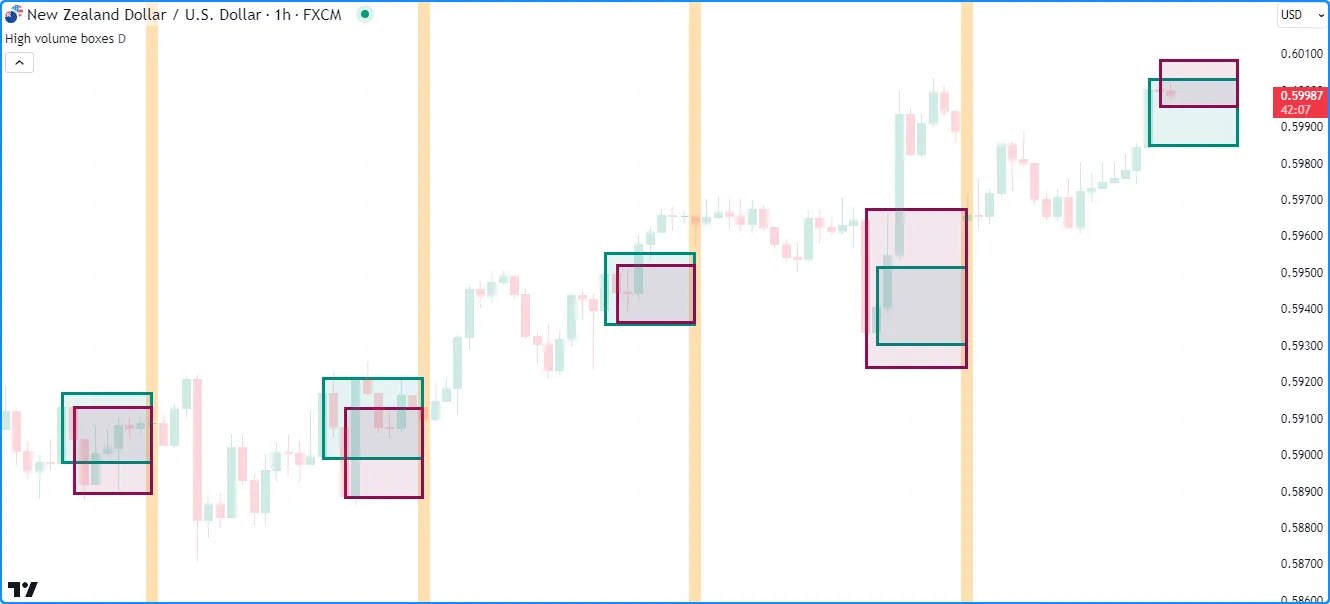
此示例使用框来可视化用户定义的 上成交量最高的向上和向下条形图的范围
timeframe。当脚本检测到
的变化timeframe时,它会
为其和变量分配新的框,重置其和
值,并突出显示图表背景。upBoxdownBoxupVolumedownVolume
当向上或向下条形图的
成交量
超过upVolume或 时downVolume,脚本会更新成交量跟踪变量并调用
box.set_top_left_point()
和
box.set_bottom_right_point()
来更新upBox或坐标。设置器使用chart.point.now()
和
chart.point.from_time()创建的
图表点downBox的信息
将该条形图的
高值
和低值
从当前时间投射到
的收盘时间:timeframe
//@version=5
indicator("Modifying boxes demo", "High volume boxes", true, max_boxes_count = 100)

//@variable The timeframe of the calculation.
string timeframe = input.timeframe("D", "Timeframe")

//@variable A box projecting the range of the upward bar with the highest `volume` over the `timeframe`.
var box upBox = na
//@variable A box projecting the range of the downward bar with the lowest `volume` over the `timeframe`.
var box downBox = na
//@variable The highest volume of upward bars over the `timeframe`.
var float upVolume = na
//@variable The highest volume of downward bars over the `timeframe`.
var float downVolume = na

// Color variables.
var color upBorder   = color.teal
var color upFill     = color.new(color.teal, 90)
var color downBorder = color.maroon
var color downFill   = color.new(color.maroon, 90)

//@variable The closing time of the `timeframe`.
int closeTime = time_close(timeframe)
//@variable Is `true` when a new bar starts on the `timeframe`.
bool changeTF = timeframe.change(timeframe)

//@variable The `chart.point` for the top-left corner of the boxes. Contains `index` and `time` information.
topLeft = chart.point.now(high)
//@variable The `chart.point` for the bottom-right corner of the boxes. Does not contain `index` information.
bottomRight = chart.point.from_time(closeTime, low)

if changeTF and not na(volume)
    if close > open
        // Update `upVolume` and `downVolume` values.
        upVolume   := volume
        downVolume := 0.0
        // Draw a new `upBox` using `time` and `price` info from the `topLeft` and `bottomRight` points.
        upBox := box.new(topLeft, bottomRight, upBorder, 3, xloc = xloc.bar_time, bgcolor = upFill)
        // Draw a new `downBox` with `na` coordinates.
        downBox := box.new(na, na, na, na, downBorder, 3, xloc = xloc.bar_time, bgcolor = downFill)
    else
        // Update `upVolume` and `downVolume` values.
        upVolume   := 0.0
        downVolume := volume
        // Draw a new `upBox` with `na` coordinates.
        upBox := box.new(na, na, na, na, upBorder, 3, xloc = xloc.bar_time, bgcolor = upFill)
        // Draw a new `downBox` using `time` and `price` info from the `topLeft` and `bottomRight` points.
        downBox := box.new(topLeft, bottomRight, downBorder, 3, xloc = xloc.bar_time, bgcolor = downFill)
// Update the ``upVolume`` and change the ``upBox`` coordinates when volume increases on an upward bar.
else if close > open and volume > upVolume
    upVolume := volume
    box.set_top_left_point(upBox, topLeft)
    box.set_bottom_right_point(upBox, bottomRight)
// Update the ``downVolume`` and change the ``downBox`` coordinates when volume increases on a downward bar.
else if close <= open and volume > downVolume
    downVolume := volume
    box.set_top_left_point(downBox, topLeft)
    box.set_bottom_right_point(downBox, bottomRight)

// Highlight the background when a new `timeframe` bar starts.
bgcolor(changeTF ? color.new(color.orange, 70) : na, title = "Timeframe change highlight")
注意:
- indicator
()
函数调用包含
max_boxes_count = 100,这意味着脚本将保留图表上的最后 100 个框。 - 我们在此示例中使用了box.new()的
两个重载
。在 的第一个柱状图上,脚本在柱状图上升时调用第一个重载,在柱状图下降时调用该重载。它使用第二个重载将具有na值的新框分配
给该柱状图上的另一个框变量。
timeframeupBoxdownBox
盒子样式
用户可以在他们的box.new()
或
box.set_border_style()line.style_*函数调用中
包含以下变量之一
来设置其脚本绘制的框的边框样式:
| 争论 | 盒子 |
|---|---|
line.style_solid |  |
line.style_dotted |  |
line.style_dashed |  |
读取框值
命名box.*空间具有getter函数,允许脚本从框实例中检索坐标值:
- box.get_left()
和
box.get_right()
分别获取框左边缘和右边缘的 x 坐标
id。返回的值是否表示条形索引或时间值取决于框的xloc属性。 - box.get_top()
和
box.get_bottom()
分别获取框的顶部和底部 y 坐标
id。
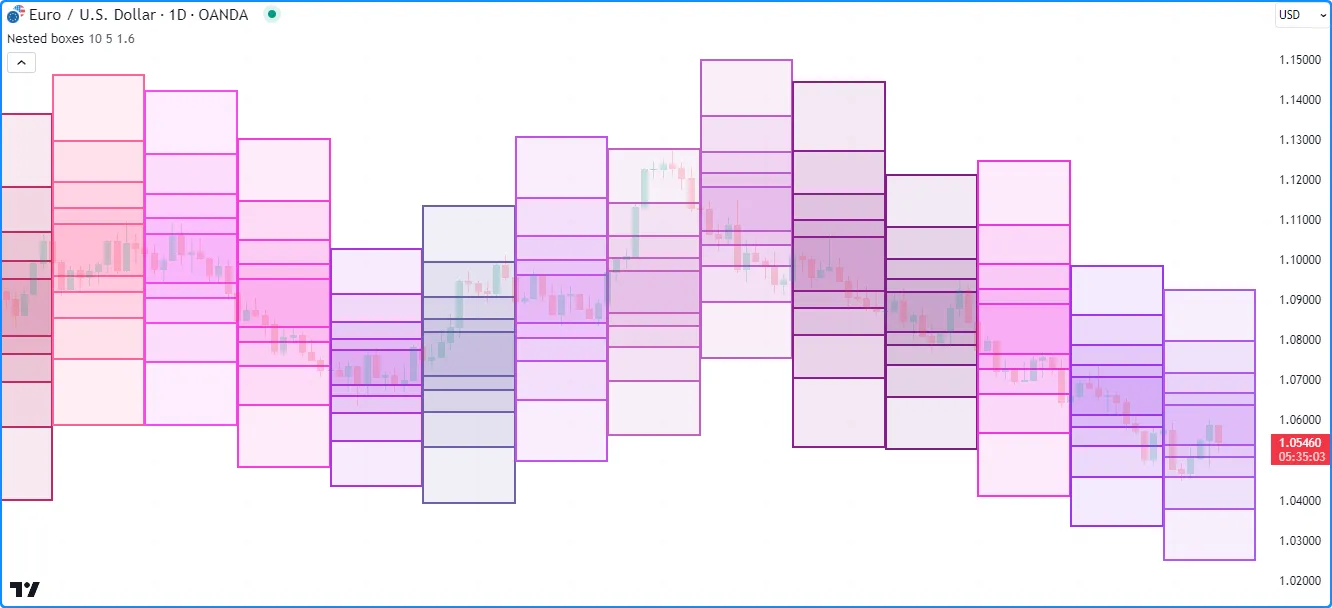
下面的示例绘制了方框,以可视化一段时间内的假设价格范围length。在每个新周期开始时,它使用平均蜡烛范围乘以输入来计算以hl2
价格为中心且高度为scaleFactor的方框的角点
。绘制第一个方框后,它会在for循环内创建新的方框
。initialRangenumberOfBoxes - 1
在每次循环迭代中,脚本lastBoxDrawn通过
从只读
box.all数组中检索最后一个元素来获取
,然后调用
box.get_top()
和
box.get_bottom()
来获取其 y 坐标。它使用这些值来计算比前一个框高 10 倍的新框的坐标:scaleFactor
//@version=5
indicator("Reading box values demo", "Nested boxes", overlay = true, max_boxes_count = 500)

//@variable The number of bars in the range calculation.
int length = input.int(10, "Length", 2, 500)
//@variable The number of nested boxes drawn on each period.
int numberOfBoxes = input.int(5, "Nested box count", 1)
//@variable The scale factor applied to each box.
float scaleFactor = input.float(1.6, "Scale factor", 1)

//@variable The initial box range.
float initialRange = scaleFactor * ta.sma(high - low, length)

if bar_index % length == 0
    //@variable The top-left `chart.point` for the initial box. Does not contain `time` information.
    topLeft = chart.point.from_index(bar_index, hl2 + initialRange / 2)
    //@variable The bottom-right `chart.point` for the initial box. Does not contain `time` information.
    bottomRight = chart.point.from_index(bar_index + length, hl2 - initialRange / 2)

    // Calculate border and fill colors of the boxes.
    borderColor = color.rgb(math.random(100, 255), math.random(0, 100), math.random(100, 255))
    bgColor = color.new(borderColor, math.max(100 * (1 - 1/numberOfBoxes), 90))

    // Draw a new box using the `topLeft` and `bottomRight` points. Uses their `index` fields as x-coordinates.
    box.new(topLeft, bottomRight, borderColor, 2, bgcolor = bgColor)

    if numberOfBoxes > 1
        // Loop to create additional boxes.
        for i = 1 to numberOfBoxes - 1
            //@variable The last box drawn by the script.
            box lastBoxDrawn = box.all.last()

            //@variable The top price of the last box.
            float top = box.get_top(lastBoxDrawn)
            //@variable The bottom price of the last box.
            float bottom = box.get_bottom(lastBoxDrawn)

            //@variable The scaled range of the new box.
            float newRange = scaleFactor * (top - bottom) * 0.5

            // Update the `price` fields of the `topLeft` and `bottomRight` points.
            // This does not affect the coordinates of previous boxes.
            topLeft.price     := hl2 + newRange
            bottomRight.price := hl2 - newRange

            // Draw a new box using the updated `topLeft` and `bottomRight` points.
            box.new(topLeft, bottomRight, borderColor, 2, bgcolor = bgColor)
注意:
- indicator
()
函数调用使用
max_boxes_count = 500,这意味着脚本可以在图表上显示最多 500 个框。 - 每幅画都有一个
right索引length条,索引条超出left索引范围。由于这些画的 x 坐标最多可以延伸到 500 个条,因此我们将输入maxval的 设置length为 500。 - 在每个新时期,脚本都会使用随机的
color.rgb()
值作为框的
border_color和。bgcolor - 每个
box.new()调用都会从
分配给和变量的chart.point对象
中复制坐标
,这就是为什么脚本可以在每次循环迭代中修改它们的字段而不影响其他框的原因。
topLeftbottomRightprice
克隆盒
要克隆特定框id,请使用
box.copy()。此函数复制框及其属性。对复制框的任何更改都不会影响原始框。
例如,此脚本originalBox在第一个柱上声明一个变量,并
每隔一个柱
为其分配一个新框。在其他柱上,它使用box.copy()
创建一个并调用函数来
修改其属性。如下图所示,这些更改不会修改:lengthcopiedBoxbox.set_*()originalBox
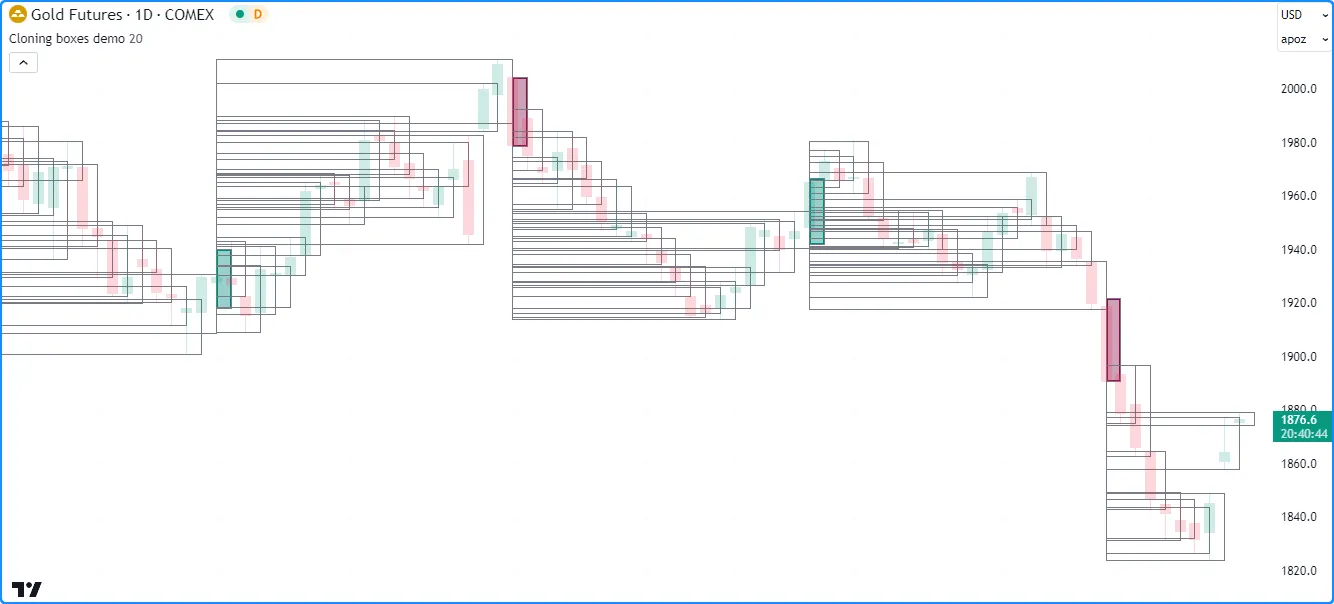
//@version=5
indicator("Cloning boxes demo", overlay = true, max_boxes_count = 500)

//@variable The number of bars between each new mainLine assignment.
int length = input.int(20, "Length", 2)

//@variable The `chart.point` for the top-left of the `originalBox`. Contains `time` and `index` information.
topLeft = chart.point.now(high)
//@variable The `chart.point` for the bottom-right of the `originalBox`. Does not contain `time` information.
bottomRight = chart.point.from_index(bar_index + 1, low)

//@variable A new box with `topLeft` and `bottomRight` corners on every `length` bars.
var box originalBox = na

//@variable Is teal when the bar is rising, maroon when it's falling.
color originalColor = close > open ? color.teal : color.maroon

if bar_index % length == 0
    // Assign a new box using the `topLeft` and `bottomRight` info to the `originalBox`.
    // This box uses the `index` fields from the points as x-coordinates.
    originalBox := box.new(topLeft, bottomRight, originalColor, 2, bgcolor = color.new(originalColor, 60))
else
    //@variable A clone of the `originalBox`.
    box copiedBox = box.copy(originalBox)
    // Modify the `copiedBox`. These changes do not affect the `originalBox`.
    box.set_top(copiedBox, high)
    box.set_bottom_right_point(copiedBox, bottomRight)
    box.set_border_color(copiedBox, color.gray)
    box.set_border_width(copiedBox, 1)
    box.set_bgcolor(copiedBox, na)
删除框
要删除脚本绘制的框,请使用
box.delete()。与*.delete()其他绘图命名空间中的函数一样,此函数对于有条件地删除框或在图表上保留特定数量的框非常方便。
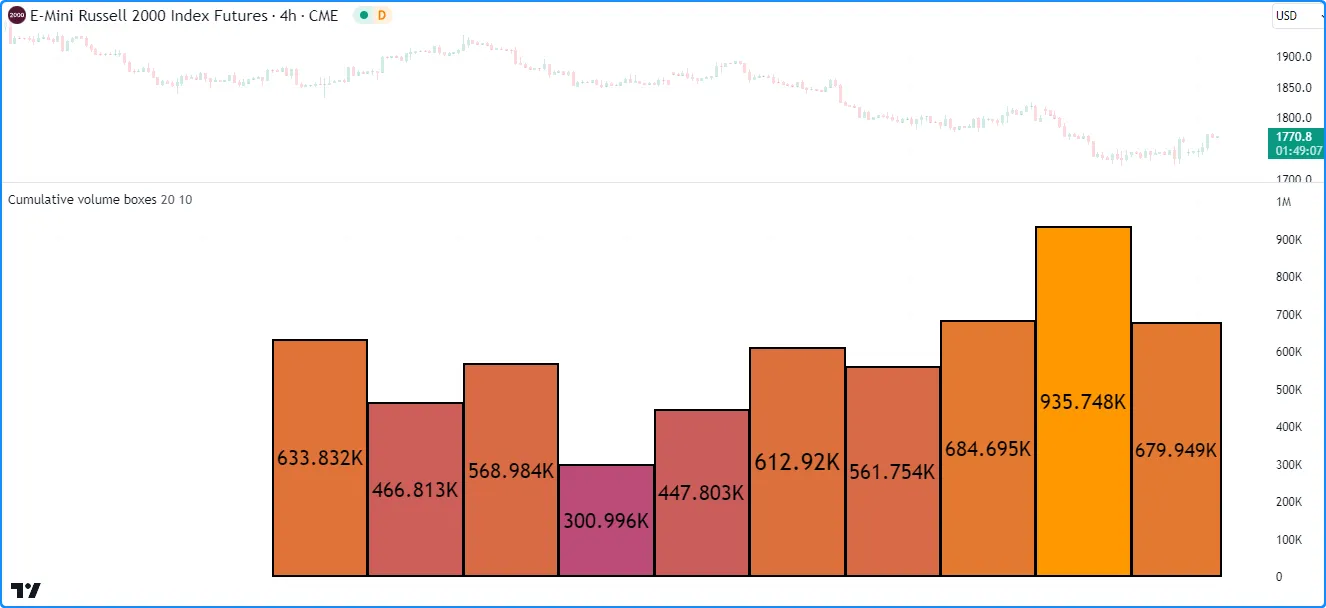
此示例显示代表周期性累积成交量值的框。脚本每条
创建一个新的框 ID 并将其存储在boxes数组
中length。如果数组的大小
超出指定的值numberOfBoxes,脚本将使用
array.shift()从数组中删除最旧的框,并使用box.delete()
将其删除
。
在其他柱状图上,它
通过修改数组
中最后一个框的
来累积
每个周期
的交易量。然后,脚本使用
for 循环查找
数组所有框的 ,并
根据其
box.get_top()
值相对于 ,将每个框的设置为渐变色:topboxeshighestTopbgcolorhighestTop
//@version=5

//@variable The maximum number of boxes to show on the chart.
const int MAX_BOXES_COUNT = 500

indicator("Deleting boxes demo", "Cumulative volume boxes", format = format.volume, max_boxes_count = MAX_BOXES_COUNT)

//@variable The number of bars in each period.
int length = input.int(20, "Length", 1)
//@variable The maximum number of volume boxes in the calculation.
int numberOfBoxes = input.int(10, "Number of boxes", 1, MAX_BOXES_COUNT)

//@variable An array containing the ID of each box displayed by the script.
var boxes = array.new<box>()

if bar_index % length == 0
    // Push a new box into the `boxes` array. The box has the default `xloc.bar_index` property.
    boxes.push(box.new(bar_index, 0, bar_index + 1, 0, #000000, 2, text_color = #000000))
    // Shift the oldest box out of the array and delete it when the array's size exceeds the `numberOfBoxes`.
    if boxes.size() > numberOfBoxes
        box.delete(boxes.shift())

//@variable The last box drawn by the script as of the current chart bar.
box lastBox = boxes.last()
// Add the current bar's volume to the top of the `lastBox` and update the `right` index.
lastBox.set_top(lastBox.get_top() + volume)
lastBox.set_right(bar_index + 1)
// Display the top of the `lastBox` as volume-formatted text.
lastBox.set_text(str.tostring(lastBox.get_top(), format.volume))

//@variable The highest `top` of all boxes in the `boxes` array.
float highestTop = 0.0
for id in boxes
    highestTop := math.max(id.get_top(), highestTop)

// Set the `bgcolor` of each `id` in `boxes` with a gradient based on the ratio of its `top` to the `highestTop`.
for id in boxes
    id.set_bgcolor(color.from_gradient(id.get_top() / highestTop, 0, 1, color.purple, color.orange))
注意:
- 在代码顶部,我们声明了一个
MAX_BOXES_COUNT具有“const int”限定类型的变量。我们将此值用作indicator()max_boxes_count函数中的 值 和输入的最大可能值 。numberOfBoxes - 该脚本使用了box.new()函数的第二次重载
,它分别指定盒子的
left、top、right和bottom坐标。 - 我们在
indicator()调用中包含了
format.volume
作为参数
,它告诉脚本图表窗格的 y 轴代表成交量值。每个框还将其顶部值显示
为
成交量格式的
文本。
format
折线
Pine Script™ 折线是一种高级绘图,它 使用直线或曲线段按顺序连接chart.point实例数组 中 的坐标 。
这些强大的绘图功能可以连接图表上任何可用位置的多达 10,000 个点,允许脚本绘制自定义系列、多边形和其他复杂的几何形状,而这些形状使用线条 或框 对象很难或不可能绘制 。
命名空间具有以下用于创建和管理折线polyline.*对象的内置功能
:
- polyline.new () 函数创建一个新的折线实例。
- polyline.delete () 函数删除现有的折线实例。
- polyline.all
变量
引用一个只读
数组,
其中包含脚本显示的所有折线的 ID。数组的
大小
取决于
max_polylines_countindicator () 或 strategies() 声明语句以及脚本绘制的折线数量。
与线 或框不同,折线没有修改或读取其属性的功能。若要在图表上重新绘制折线,可以删除现有实例并创建具有所需更改的新折线。
创建折线
polyline.new () 函数创建一个新的 折线 实例以显示在图表上。 它具有以下签名:
polyline.new(points, curved, closed, xloc, line_color, fill_color, line_style, line_width, force_overlay) → series polyline以下八个参数影响折线绘制的行为:
points
indextimexloc
curved
points。默认值为false,表示使用直线段。
closed
points连接到第一个,形成闭合折线。默认值为false。
xloc
points的哪个字段作为其 x 坐标。当其值为
xloc.bar_index时,该函数使用这些index字段来创建折线。当其值为
xloc.bar_time时,该函数使用这些time字段。默认值为
xloc.bar_index。
line_color
color.blue。
fill_color
line_style
line_width
force_overlay
true,绘图将显示在主图表窗格中,即使脚本占用单独的窗格也是如此。可选。默认值为false。
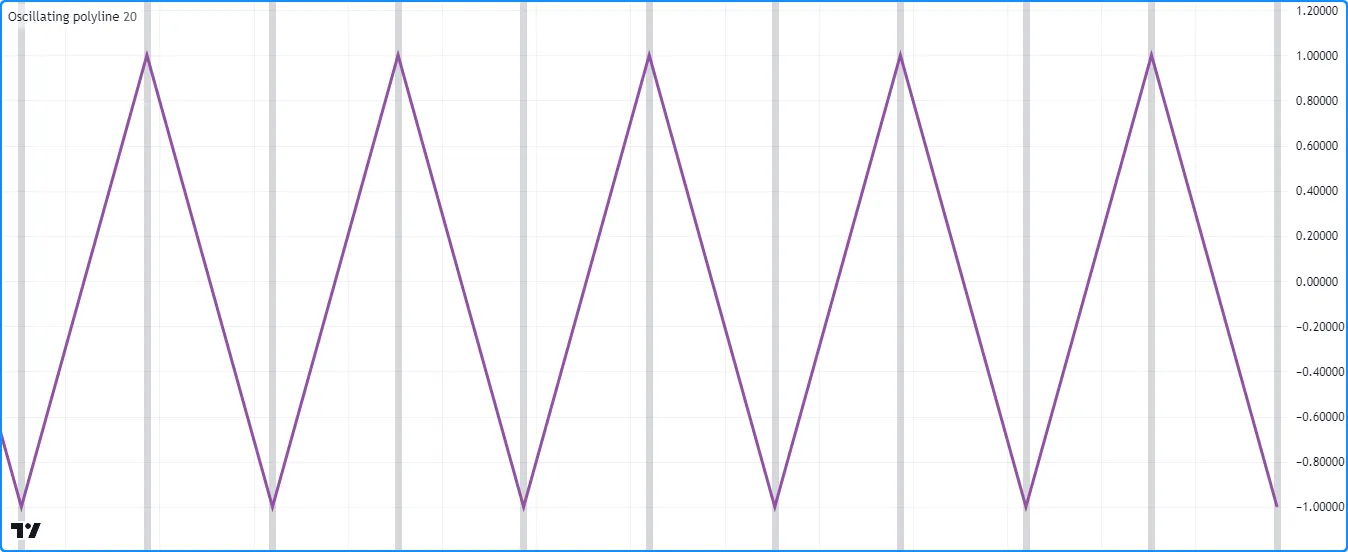
此脚本演示了在图表上绘制折线的简单示例。它将
一个
具有交替值的
新
chart.point推送到数组中,并在每个条形中使用bgcolor()为背景着色
一次。pricepointslength
在最后确认的历史柱上,脚本在图表上绘制一条新的折线,连接 数组中 每个图表点的坐标,从第一个开始:
//@version=5
indicator("Creating polylines demo", "Oscillating polyline")

//@variable The number of bars between each point in the drawing.
int length = input.int(20, "Length between points", 2)

//@variable An array of `chart.point` objects to sequentially connect with a polyline.
var points = array.new<chart.point>()

//@variable The y-coordinate of each point in the `points`. Alternates between 1 and -1 on each `newPoint`.
var int yValue = 1

//@variable Is `true` once every `length` bars, `false` otherwise.
bool newPoint = bar_index % length == 0

if newPoint
    // Push a new `chart.point` into the `points`. The new point contains `time` and `index` info.
    points.push(chart.point.now(yValue))
    // Change the sign of the `yValue`.
    yValue *= -1

// Draw a new `polyline` on the last confirmed historical chart bar.
// The polyline uses the `time` field from each `chart.point` in the `points` array as x-coordinates.
if barstate.islastconfirmedhistory
    polyline.new(points, xloc = xloc.bar_time, line_color = #9151A6, line_width = 3)

// Highlight the chart background on every `newPoint` condition.
bgcolor(newPoint ? color.new(color.gray, 70) : na, title = "New point highlight")
注意:
- 该脚本仅使用一条折线将数组中的 每个图表点 与直线段连接起来 ,并且该绘图从第一个条开始跨越整个可用的图表数据。
- 虽然可以使用线条实现类似的效果
,但这样做需要
在每次出现该条件时创建一个新的线条
newPoint实例,并且这种绘制最多只能包含 500 条线段。另一方面,这种单一未封闭折线绘制最多可以包含 9,999 条线段。
曲线图
折线可以绘制出无法用线或
框生成的曲线。启用polyline.new()函数的参数
时
,生成的折线会
在其
数组中每个chart.point的坐标之间
插入非线性值
,以生成曲线效果。curvedpoints
例如,我们上例中的“振荡折线”脚本使用直线段来生成类似于三角波的图形,即在波峰和波谷之间呈之字形的波形。如果我们将该示例中的polyline.new()
调用中的curved参数
设置为 ,则生成的图形将使用曲线段连接点,从而生成类似于正弦波的平滑非线性形状:true
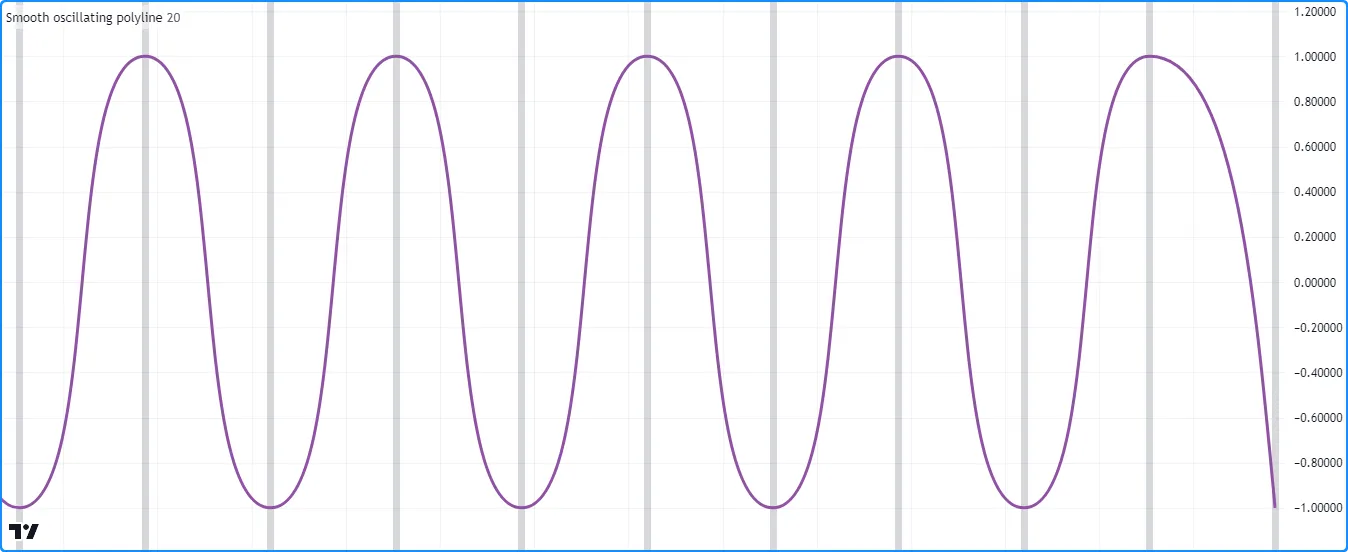
//@version=5
indicator("Curved drawings demo", "Smooth oscillating polyline")

//@variable The number of bars between each point in the drawing.
int length = input.int(20, "Length between points", 2)

//@variable An array of `chart.point` objects to sequentially connect with a polyline.
var points = array.new<chart.point>()

//@variable The y-coordinate of each point in the `points`. Alternates between 1 and -1 on each `newPoint`.
var int yValue = 1

//@variable Is `true` once every `length` bars, `false` otherwise.
bool newPoint = bar_index % length == 0

if newPoint
    // Push a new `chart.point` into the `points`. The new point contains `time` and `index` info.
    points.push(chart.point.now(yValue))
    // Change the sign of the `yValue`.
    yValue *= -1

// Draw a new curved `polyline` on the last confirmed historical chart bar.
// The polyline uses the `time` field from each `chart.point` in the `points` array as x-coordinates.
if barstate.islastconfirmedhistory
    polyline.new(points, curved = true, xloc = xloc.bar_time, line_color = #9151A6, line_width = 3)

// Highlight the chart background on every `newPoint` condition.
bgcolor(newPoint ? color.new(color.gray, 70) : na, title = "New point highlight")
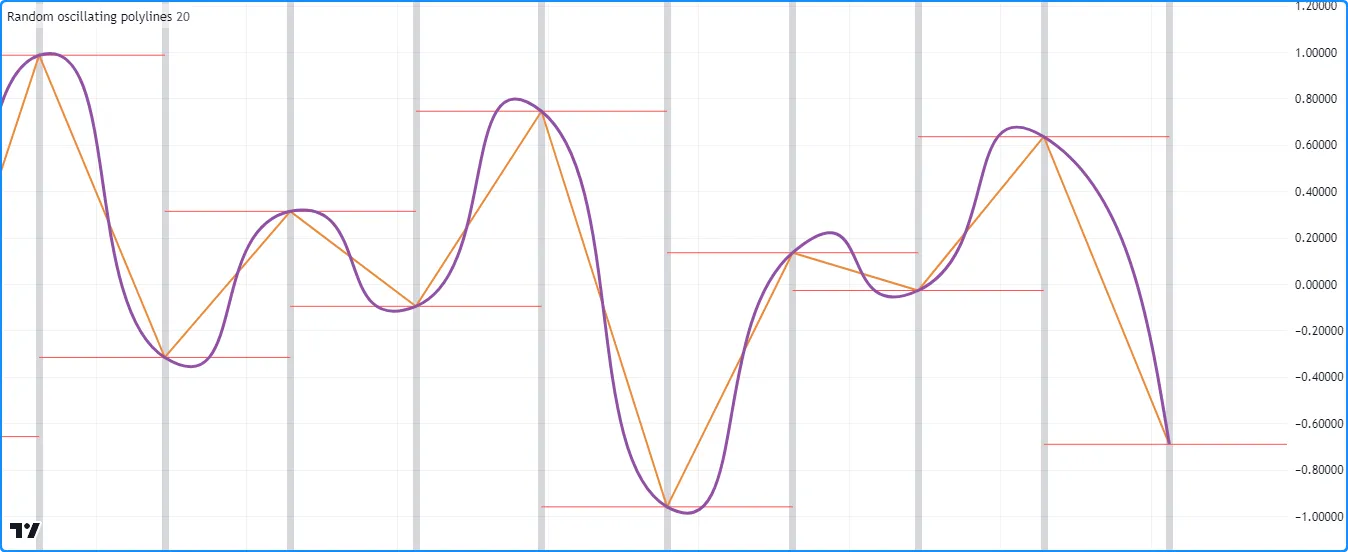
请注意,在此示例中,平滑曲线具有相对一致的行为,并且绘图的任何部分都不会超出其定义的坐标,而绘制弯曲折线时并非总是如此。用于构造折线的数据会严重影响其在其点之间插入的平滑分段函数。在某些情况下,插值曲线可能会超出其实际坐标。
让我们
在示例数组中添加一些图表点points的变化来演示此行为。在下面的版本中,脚本
在
chart.point.now()yValue调用中将 乘以一个
随机值
。
为了直观地展示这一行为,此脚本还在
数组
中每个
chart.point的值
处创建一条水平线,并显示另一条用直线段连接相同点的折线。正如我们在图表上看到的,两条折线都经过数组中的所有坐标。但是,弯曲的折线偶尔会超出水平线指示的垂直边界
,而使用直线段绘制的折线则不会:pricepointspoints
//@version=5
indicator("Curved drawings demo", "Random oscillating polylines")

//@variable The number of bars between each point in the drawing.
int length = input.int(20, "Length between points", 2)

//@variable An array of `chart.point` objects to sequentially connect with a polyline.
var points = array.new<chart.point>()

//@variable The sign of each `price` in the `points`. Alternates between 1 and -1 on each `newPoint`.
var int yValue = 1

//@variable Is `true` once every `length` bars.
bool newPoint = bar_index % length == 0

if newPoint
    // Push a new `chart.point` with a randomized `price` into the `points`.
    // The new point contains `time` and `index` info.
    points.push(chart.point.now(yValue * math.random()))
    // Change the sign of the `yValue`.
    yValue *= -1

    //@variable The newest `chart.point`.
    lastPoint = points.last()
    // Draw a horizontal line at the `lastPoint.price`. This line uses the default `xloc.bar_index`.
    line.new(lastPoint.index - length, lastPoint.price, lastPoint.index + length, lastPoint.price, color = color.red)

// Draw two `polyline` instances on the last confirmed chart bar.
// Both polylines use the `time` field from each `chart.point` in the `points` array as x-coordinates.
if barstate.islastconfirmedhistory
    polyline.new(points, curved = false, xloc = xloc.bar_time, line_color = #EB8A3B, line_width = 2)
    polyline.new(points, curved = true, xloc = xloc.bar_time, line_color = #9151A6, line_width = 3)

// Highlight the chart background on every `newPoint` condition.
bgcolor(newPoint ? color.new(color.gray, 70) : na, title = "New point highlight")
封闭形状
由于单条折线可以包含多条直线或曲线段,并且参数closed允许绘图连接其数组中第一个和最后一个
chart.point 的坐标
,
我们points可以使用折线绘制许多不同类型的封闭多边形。
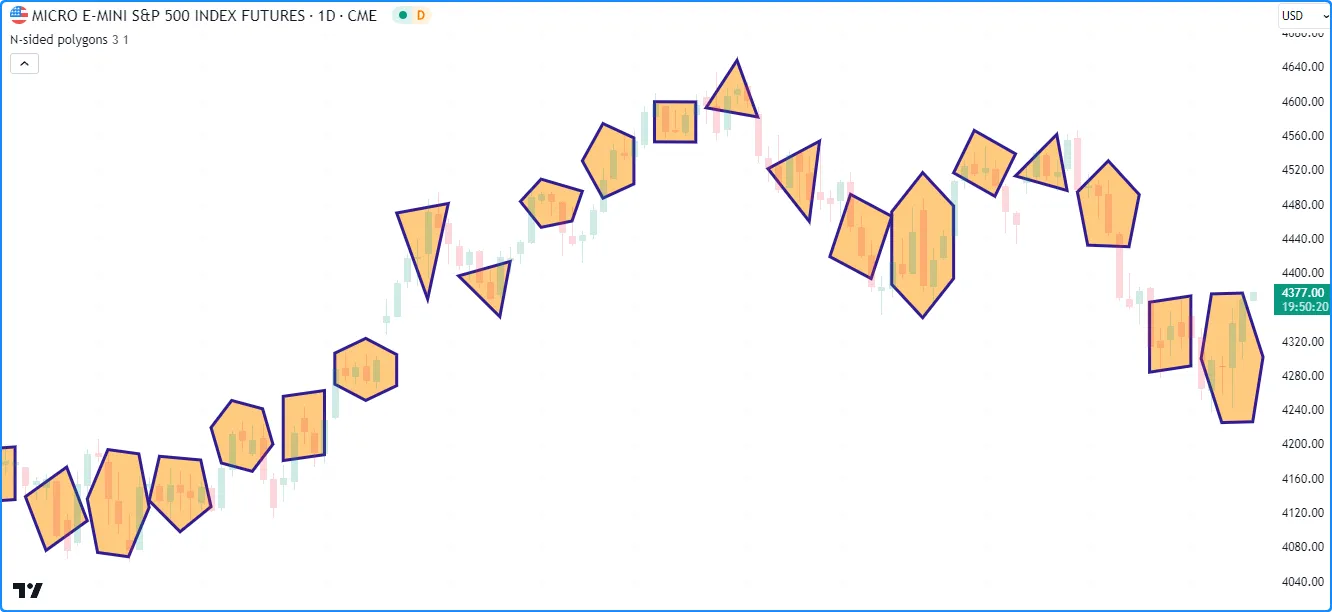
让我们在 Pine 中绘制一些多边形。以下脚本定期绘制以 hl2 价格值为中心的随机多边形。
每次出现该newPolygon条件时,它
都会清除
数组points,
根据
math.random()numberOfSides值计算新多边形的和
,然后使用for 循环将新的
图表点推送到数组中
,这些点包含具有
和半轴
的椭圆路径的阶梯坐标。该脚本通过使用带有直线段的闭合折线连接数组
中的每个chart.point来绘制多边形
:rotationOffsetnumberOfSidesxScaleyScalepoints
//@version=5
indicator("Closed shapes demo", "N-sided polygons", true)

//@variable The size of the horizontal semi-axis.
float xScale = input.float(3.0, "X scale", 1.0)
//@variable The size of the vertical semi-axis.
float yScale = input.float(1.0, "Y scale") * ta.atr(2)

//@variable An array of `chart.point` objects containing vertex coordinates.
var points = array.new<chart.point>()

//@variable The condition that triggers a new polygon drawing. Based on the horizontal axis to prevent overlaps.
bool newPolygon = bar_index % int(math.round(2 * xScale)) == 0 and barstate.isconfirmed

if newPolygon
    // Clear the `points` array.
    points.clear()

    //@variable The number of sides and vertices in the new polygon.
    int numberOfSides = int(math.random(3, 7))
    //@variable A random rotation offset applied to the new polygon, in radians.
    float rotationOffset = math.random(0.0, 2.0) * math.pi
    //@variable The size of the angle between each vertex, in radians.
    float step = 2 * math.pi / numberOfSides

    //@variable The counter-clockwise rotation angle of each vertex.
    float angle = rotationOffset

    for i = 1 to numberOfSides
        //@variable The approximate x-coordinate from an ellipse at the `angle`, rounded to the nearest integer.
        int xValue = int(math.round(xScale * math.cos(angle))) + bar_index
        //@variable The y-coordinate from an ellipse at the `angle`.
        float yValue = yScale * math.sin(angle) + hl2

        // Push a new `chart.point` containing the `xValue` and `yValue` into the `points` array.
        // The new point does not contain `time` information.
        points.push(chart.point.from_index(xValue, yValue))
        // Add the `step` to the `angle`.
        angle += step

    // Draw a closed polyline connecting the `points`.
    // The polyline uses the `index` field from each `chart.point` in the `points` array.
    polyline.new(
         points, closed = true, line_color = color.navy, fill_color = color.new(color.orange, 50), line_width = 3
     )
注意:
- 此示例显示图表上最后约 50 条折线,因为我们没有
max_polylines_count在 indicator() 函数调用中指定值。 - 该
yScale计算将 input.float() 乘以 ta.atr(2) ,以使图纸的垂直比例适应最近的价格范围。 - 生成的多边形的最大宽度为水平半轴 (
2 * xScale) 的两倍,四舍五入为最接近的整数。newPolygon条件使用此值来防止多边形绘图重叠。 - 脚本将
xValue计算结果四舍五入为最接近的整数,因为chart.pointindex的字段 仅接受 int 值,因为图表的 x 轴不包含分数条形索引。
删除折线
要删除特定的折线id,请使用
polyline.delete()。此函数
从脚本及其在图表上的绘图中删除折线对象。
与其他绘图对象一样,我们可以使用 polyline.delete() 来维护特定数量的折线绘图或有条件地从图表中删除绘图。
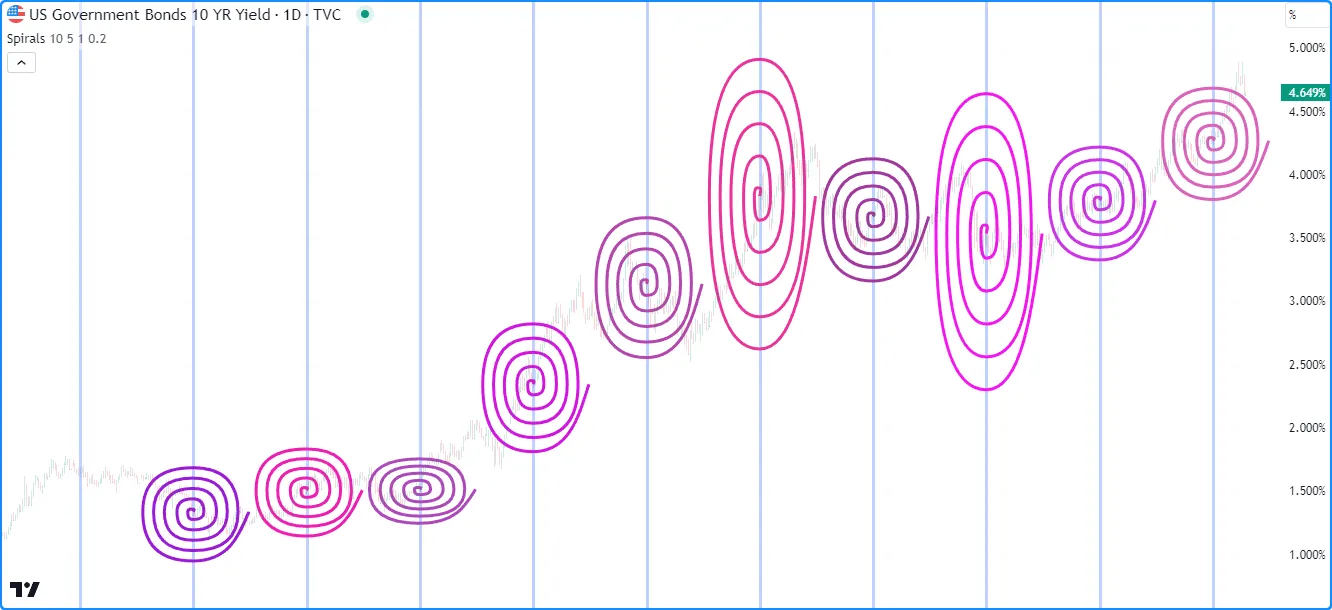
例如,下面的脚本定期绘制近似的算术螺旋,并将其折线 ID 存储在一个 数组中,并 使用该数组作为队列来管理其显示的绘图数量。
当newSpiral条件发生时,脚本会创建一个points
数组并
在for 循环中添加图表点。在每次循环迭代中,它都会调用用户定义函数来创建一个新的
chart.point
,其中包含相对于 增长的椭圆路径的阶梯值。然后,脚本会创建一个随机颜色的
曲线折线,连接 的坐标并将
其 ID推送到数组中。spiralPoint()
anglepointspolylines
当数组的
大小
超出指定的值时numberOfSpirals,脚本将使用
array.shift()删除最旧的折线,并使用polyline.delete()
删除对象
:
//@version=5

//@variable The maximum number of polylines allowed on the chart.
const int MAX_POLYLINES_COUNT = 100

indicator("Deleting polylines example", "Spirals", true, max_polylines_count = MAX_POLYLINES_COUNT)

//@variable The number of spiral drawings on the chart.
int numberOfSpirals = input.int(10, "Spirals shown", 1, MAX_POLYLINES_COUNT)
//@variable The number of full spiral rotations to draw.
int rotations = input.int(5, "Rotations", 1)
//@variable The scale of the horizontal semi-axis.
float xScale = input.float(1.0, "X scale")
//@variable The scale of the vertical semi-axis.
float yScale = input.float(0.2, "Y scale") * ta.atr(2)

//@function Calculates an approximate point from an elliptically-scaled arithmetic spiral.
//@returns  A `chart.point` with `index` and `price` information.
spiralPoint(float angle, int xOffset, float yOffset) =>
    result = chart.point.from_index(
         int(math.round(angle * xScale * math.cos(angle))) + xOffset,
         angle * yScale * math.sin(angle) + yOffset
     )

//@variable An array of polylines.
var polylines = array.new<polyline>()

//@variable The condition to create a new spiral.
bool newSpiral = bar_index % int(math.round(4 * math.pi * rotations * xScale)) == 0

if newSpiral
    //@variable An array of `chart.point` objects for the `spiral` drawing.
    points = array.new<chart.point>()
    //@variable The counter-clockwise angle between calculated points, in radians.
    float step = math.pi / 2
    //@variable The rotation angle of each calculated point on the spiral, in radians.
    float theta = 0.0
    // Loop to create the spiral's points. Creates 4 points per full rotation.
    for i = 0 to rotations * 4
        //@variable A new point on the calculated spiral.
        chart.point newPoint = spiralPoint(theta, bar_index, ohlc4)
        // Add the `newPoint` to the `points` array.
        points.push(newPoint)
        // Add the `step` to the `theta` angle.
        theta += step

    //@variable A random color for the new `spiral` drawing.
    color spiralColor = color.rgb(math.random(150, 255), math.random(0, 100), math.random(150, 255))
    //@variable A new polyline connecting the spiral points. Uses the `index` field from each point as x-coordinates.
    polyline spiral = polyline.new(points, true, line_color = spiralColor, line_width = 3)

    // Push the new `spiral` into the `polylines` array.
    polylines.push(spiral)
    // Shift the first polyline out of the array and delete it when the array's size exceeds the `numberOfSpirals`.
    if polylines.size() > numberOfSpirals
        polyline.delete(polylines.shift())

// Highlight the background when `newSpiral` is `true`.
bgcolor(newSpiral ? color.new(color.blue, 70) : na, title = "New drawing highlight")
注意:
- 我们声明了一个
MAX_POLYLINES_COUNT常量值为 100 的全局变量。脚本使用此常量作为 indicator()max_polylines_count函数中的值 和输入的值。maxvalnumberOfSpirals - 与上一节中的“N 边多边形”示例一样
,我们将 x 坐标的计算结果四舍五入为最接近的整数,因为chart.point
index的字段 只能接受 int 值。 - 尽管图形看起来很平滑,但每条折线的
数组
每条螺旋旋转
points仅包含四个 chart.point对象。由于polyline.new() 调用包含curved = true,因此每条折线都使用平滑曲线连接它们的points,从而产生螺旋实际曲率的视觉近似值。 - 每个螺旋的宽度约为
4 * math.pi * rotations * xScale,四舍五入为最接近的整数。我们在条件中使用此值newSpiral来间隔每个图形并防止重叠。
重绘折线
在某些情况下,可能需要在脚本执行过程中更改折线绘制。虽然polyline.*命名空间不包含内置的设置函数,但我们可以通过删除现有折线并分配具有所需更改的新实例来重新绘制变量或
集合引用的折线。
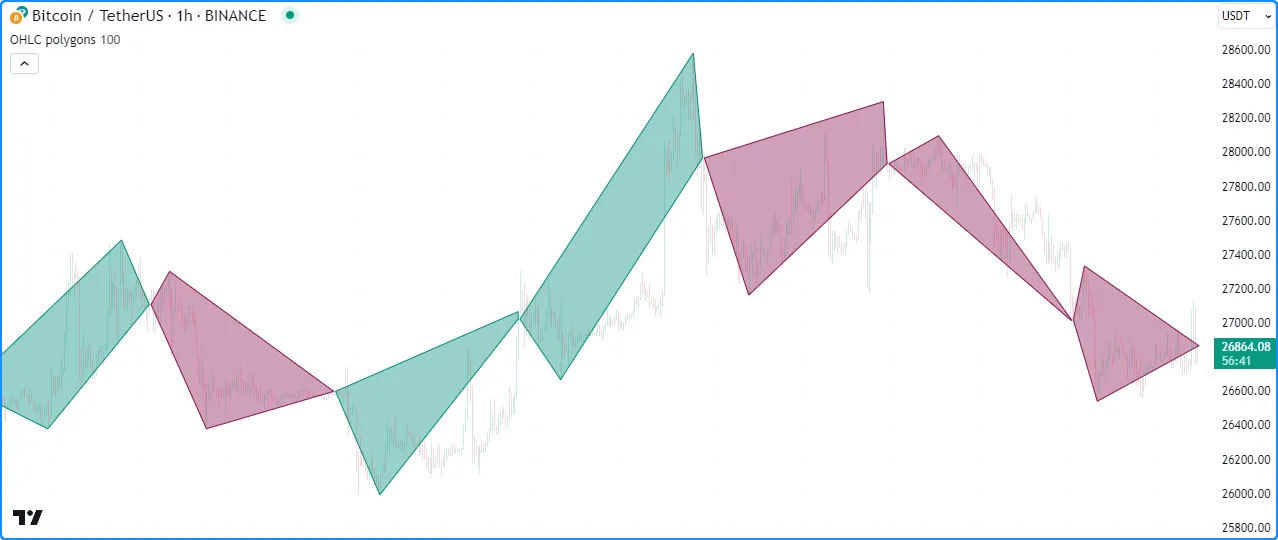
下面的示例使用 polyline.delete() 和 polyline.new() 调用来更新折线变量的值。
此脚本绘制闭合折线,连接包含条形的周期的开盘价、最高价、最低价和收盘价length。它
currentDrawing在第一个条形上创建一个变量,并在每个图表条形上为其分配一个折线 ID。它使用openPoint、highPoint、lowPoint和closePoint变量来引用
跟踪周期发展中的 OHLC 值的图表点。随着新值的出现,脚本将新的
chart.point
对象分配给变量,
使用
array.from将它们收集到一个数组中,然后创建一条连接数组点坐标的新折线
并将其分配给。currentDrawing
当newPeriod条件为时false(即当前时期未完成),脚本
会删除引用的折线,然后currentDrawing创建
新的折线,从而得到随着时期的发展而变化的动态绘图:
//@version=5
indicator("Redrawing polylines demo", "OHLC polygons", true, max_polylines_count = 100)

//@variable The length of the period.
int length = input.int(100, "Length", 1)

//@variable A `chart.point` representing the start of each period.
var chart.point openPoint = na
//@variable A `chart.point` representing the highest point of each period.
var chart.point highPoint = na
//@variable A `chart.point` representing the lowest point of each period.
var chart.point lowPoint = na
//@variable A `chart.point` representing the current bar's closing point.
closePoint = chart.point.now(close)

//@variable The current period's polyline drawing.
var polyline currentDrawing = na

//@variable Is `true` once every `length` bars.
bool newPeriod = bar_index % length == 0

if newPeriod
    // Assign new chart points to the `openPoint`, `highPoint`, and `closePoint`.
    openPoint := chart.point.now(open)
    highPoint := chart.point.now(high)
    lowPoint  := chart.point.now(low)
else
    // Assign a new `chart.point` to the `highPoint` when the `high` is greater than its `price`.
    if high > highPoint.price
        highPoint := chart.point.now(high)
    // Assign a new `chart.point` to the `lowPoint` when the `low` is less than its `price`.
    if low < lowPoint.price
        lowPoint := chart.point.now(low)

//@variable Is teal when the `closePoint.price` is greater than the `openPoint.price`, maroon otherwise.
color drawingColor = closePoint.price > openPoint.price ? color.teal : color.maroon

// Delete the polyline assigned to the `currentDrawing` if it's not a `newPeriod`.
if not newPeriod
    polyline.delete(currentDrawing)
// Assign a new polyline to the `currentDrawing`.
// Uses the `index` field from each `chart.point` in its array as x-coordinates.
currentDrawing := polyline.new(
     array.from(openPoint, highPoint, closePoint, lowPoint), closed = true,
     line_color = drawingColor, fill_color = color.new(drawingColor, 60)
 )
实时行为
线、 框和 折线 都受提交和回滚操作的影响,这些操作会影响脚本在实时条上执行时的行为。请参阅 Pine Script™ 的执行模型页面。
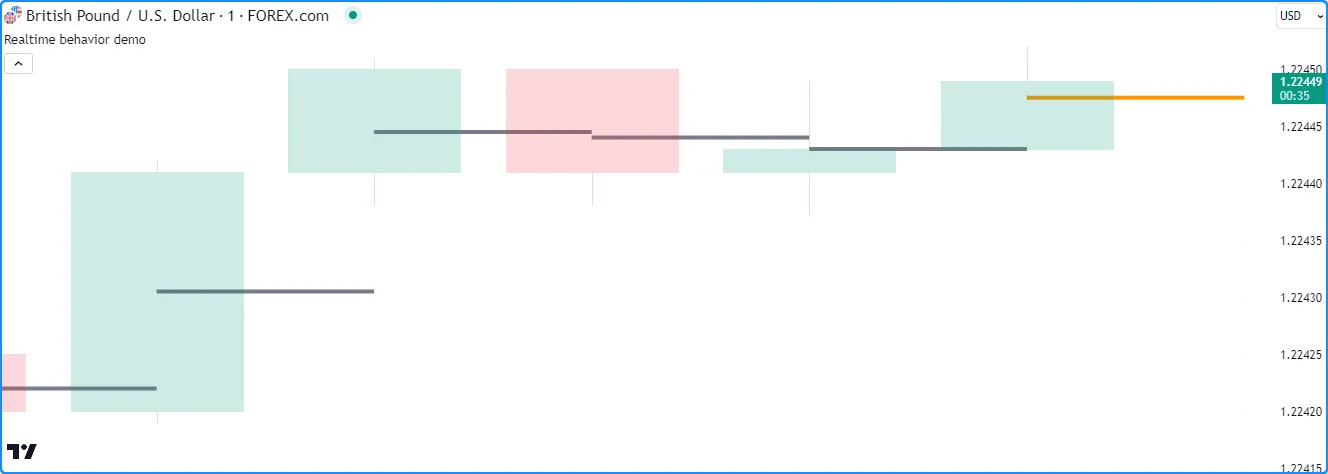
此脚本演示了在实时、未确认的图表条上执行回滚时的效果:
//@version=5
indicator("Realtime behavior demo", overlay = true)

//@variable Is orange when the `line` is subject to rollback and gray after the `line` is committed.
color lineColor = barstate.isconfirmed ? color.gray : color.orange

line.new(bar_index, hl2, bar_index + 1, hl2, color = lineColor, width = 4)
本例中的 line.new() 调用在未确认的条形图上的值发生变化时,每次迭代都会创建一个新的 线 ID 。由于每次迭代之前都会回滚,脚本会自动删除该条形图上每次更改时创建的对象。它只提交在 条形图关闭前创建的最后一条线,并且该 线 实例是已确认条形图上持续存在的线实例。
限制
对象总数
线条、 框和 折线 会消耗服务器资源,因此每个脚本的绘图总数是有限制的。当脚本创建的绘图对象数量超过允许的限制时,Pine Script™ 运行时会自动删除最旧的对象,这个过程称为垃圾收集。
单个脚本最多可包含 500 条线、500 个框和 100 条折线。用户可以通过
在脚本的
indicator()
或
strategies()
声明语句中指定max_lines_count、max_boxes_count和值来控制垃圾收集限制。max_polylines_count
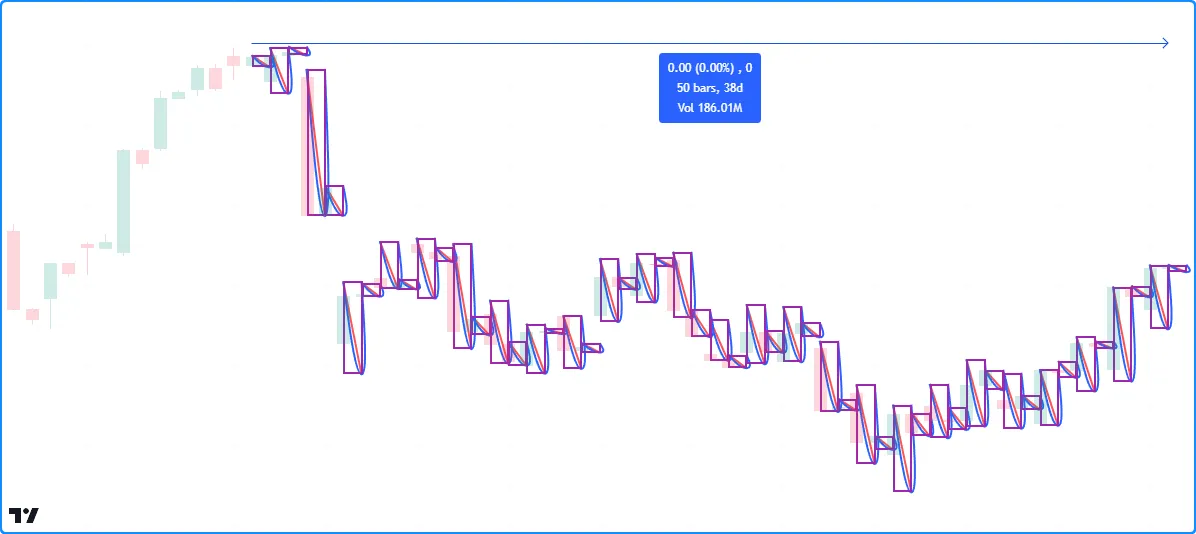
此脚本演示了 Pine 中的垃圾收集工作原理。它在每个图表条上创建新的线条、框和折线。我们尚未在
indicator()max_lines_count函数调用中为、max_boxes_count或
参数指定值
,因此脚本将保留图表上最近的约 50 条线条、框和折线,因为这是每个参数的默认设置:max_polylines_count
//@version=5
indicator("Garbage collection demo", overlay = true)

//@variable A new `chart.point` at the current `bar_index` and `high`.
firstPoint = chart.point.now(high)
//@variable A new `chart.point` one bar into the future at the current `low`.
secondPoint = chart.point.from_index(bar_index + 1, low)
//@variable A new `chart.point` one bar into the future at the current `high`.
thirdPoint = chart.point.from_index(bar_index + 1, high)

// Draw a new `line` connecting the `firstPoint` to the `secondPoint`.
line.new(firstPoint, secondPoint, color = color.red, width = 2)
// Draw a new `box` with the `firstPoint` top-left corner and `secondPoint` bottom-right corner.
box.new(firstPoint, secondPoint, color.purple, 2, bgcolor = na)
// Draw a new `polyline` connecting the `firstPoint`, `secondPoint`, and `thirdPoint` sequentially.
polyline.new(array.from(firstPoint, secondPoint, thirdPoint), true, line_width = 2)
注意:
- 我们使用了 TradingView 的“测量”绘图工具来测量脚本绘图对象覆盖的条形图数量。
未来将使用`xloc.bar_index`进行引用
使用 xloc.bar_index定位的对象 可以包含不超过 500 个条形图的 x 坐标。
其他背景
脚本不能
在函数中使用线条、框或
折线request.*()。这些类型的实例可以使用来自调用的值request.*(),但脚本只能在图表的上下文中创建和绘制它们。
timeframe这个限制也是为什么在
indicator()
声明语句中使用参数时绘制对象不起作用的原因
。
历史缓冲区和“max_bars_back”
将barstate.isrealtime与绘图结合使用 有时会产生意外结果。例如,此脚本的目的是忽略所有历史条形图并在实时 条形图上绘制跨越 300 条条形图的水平线:
//@version=5
indicator("Historical buffer demo", overlay = true)

//@variable A `chart.point` at the `bar_index` from 300 bars ago and current `close`.
firstPoint = chart.point.from_index(bar_index[300], close)
//@variable The current bar's `chart.point` containing the current `close`.
secondPoint = chart.point.now(close)

// Draw a new line on realtime bars.
if barstate.isrealtime
    line.new(firstPoint, secondPoint)
但是,它会在运行时失败并引发错误。脚本失败是因为它无法确定底层 时间 序列的历史值的缓冲区大小。虽然代码不包含内置 时间 变量,但内置 bar_index在其内部工作中 使用 时间序列。因此,从 300 个条形图开始访问bar_index 的值 需要时间序列 的历史缓冲区 至少为 300 个条形图。
Pine Script™ 包含一种机制,在大多数情况下可自动检测所需的历史缓冲区大小。它的工作原理是让脚本在有限的时间内访问任意数量的条形图的历史值。在这个脚本的情况下,使用 barstate.isrealtime 来控制线条的绘制会阻止它访问历史系列,因此它无法推断所需的历史缓冲区大小,并且脚本会失败。
这个问题的简单解决方案是使用 max_bars_back() 函数在评估条件结构之前明确定义时间 序列 的历史缓冲区 :
//@version=5
indicator("Historical buffer demo", overlay = true)

//@variable A `chart.point` at the `bar_index` from 300 bars ago and current `close.
firstPoint = chart.point.from_index(bar_index[300], close)
//@variable The current bar's `chart.point` containing the current `close`.
secondPoint = chart.point.now(close)

// Explicitly set the historical buffer of the `time` series to 300 bars.
max_bars_back(time, 300)

// Draw a new line on realtime bars.
if barstate.isrealtime
    line.new(firstPoint, secondPoint)
此类问题可能令人困惑,但非常罕见。Pine Script™ 团队希望随着时间的推移消除这些问题。