其他时间范围和数据
介绍
Pine Script™ 允许用户从其图表使用的来源和上下文以外的来源和上下文请求数据。我们在本页介绍的功能可以从各种替代来源获取数据:
- request.security()从另一个符号、时间范围或其他上下文中检索数据。
- request.security_lower_tf()检索条形内数据,即来自低于图表时间范围的时间范围的数据。
- request.currency_rate()请求每日汇率将一种货币表示的值转换为另一种货币表示的值。
- request.dividends()、request.splits() 和 request.earnings()分别检索有关发行公司的股息、拆分和收益的信息。
- request.quandl()从NASDAQ Data Link(以前称为 Quandl)检索信息。
- request.financial()从FactSet检索财务数据 。
- request.economic()检索经济和行业数据。
- request.seed()从用户维护的GitHub 存储库检索数据。
这些是命名空间中的函数的签名request.*:
request.security(symbol, timeframe, expression, gaps, lookahead, ignore_invalid_symbol, currency, calc_bars_count) → series <type>
request.security_lower_tf(symbol, timeframe, expression, ignore_invalid_symbol, currency, ignore_invalid_timeframe, calc_bars_count) → array<type>
request.currency_rate(from, to, ignore_invalid_currency) → series float
request.dividends(ticker, field, gaps, lookahead, ignore_invalid_symbol, currency) → series float
request.splits(ticker, field, gaps, lookahead, ignore_invalid_symbol) → series float
request.earnings(ticker, field, gaps, lookahead, ignore_invalid_symbol, currency) → series float
request.quandl(ticker, gaps, index, ignore_invalid_symbol) → series float
request.financial(symbol, financial_id, period, gaps, ignore_invalid_symbol, currency) → series float
request.economic(country_code, field, gaps, ignore_invalid_symbol) → series float
request.seed(source, symbol, expression, ignore_invalid_symbol, calc_bars_count) → series <type>该request.*()函数系列具有众多潜在应用。在本页中,我们将详细讨论这些函数及其一些典型用例。
共同特征
命名空间中的许多函数request.*()都有一些共同的属性和参数。在深入探讨每个函数之前,让我们先熟悉一下这些特性。
用法
所有request.*()函数都会返回“系列”结果,这意味着它们可以在每条柱状图上产生不同的值。但是,大多数request.*()
函数参数都需要“const”、“输入”或“简单”参数。
本质上,Pine Script™ 必须根据每个参数接受的限定类型request.*(),在编译脚本时或在第一个图表条上确定传递给函数
的大多数参数的值,并且这些值在脚本执行过程中不能更改。唯一的例外是
request.security()、
request.security_lower_tf()和
request.seed()中的参数
,它接受“系列”参数。expression
函数调用request.*()在每个图表条上执行,并且脚本无法在执行过程中有选择地停用它们。脚本无法调用条件结构request.*()的局部范围内的函数
,或库导出的函数和方法
,但它们可以在非导出的用户定义函数和
方法的主体内使用此类函数调用
。
request.*()在脚本中使用任何函数时,运行时性能都是一个重要的考虑因素。这些函数会对脚本性能产生相当大的影响。虽然脚本最多可以包含 40 次对request.*()命名空间的调用,但用户应努力减少脚本中的调用次数,以尽可能降低资源消耗。有关这些函数限制的更多信息,请参阅
我们的用户手册页面中有关 Pine
限制的这一部分。
`差距`
使用request.*()函数从其他上下文检索数据时,数据可能不会像当前图表那样出现在每个新条形图中。函数gaps的参数request.*()允许用户控制函数如何响应请求系列中不存在的值。
假设我们有一个脚本,该脚本使用request.security()在 1 分钟图上执行来请求图表符号的每小时数据
。在这种情况下,函数调用将仅返回涵盖符号每小时条的开盘/收盘时间的 1 分钟条上的新值。在其他图表条上,我们可以通过参数决定函数是否返回
na
值或最后可用的值gaps。
当gaps参数使用
barmerge.gaps_on时,函数将返回
所有
图表条形图上尚未从请求的上下文确认新数据的结果。否则,当参数使用
barmerge.gaps_off时,函数将使用历史条形图上最后确认的值和实时条形图上最新发展的值填充请求数据中的空白。
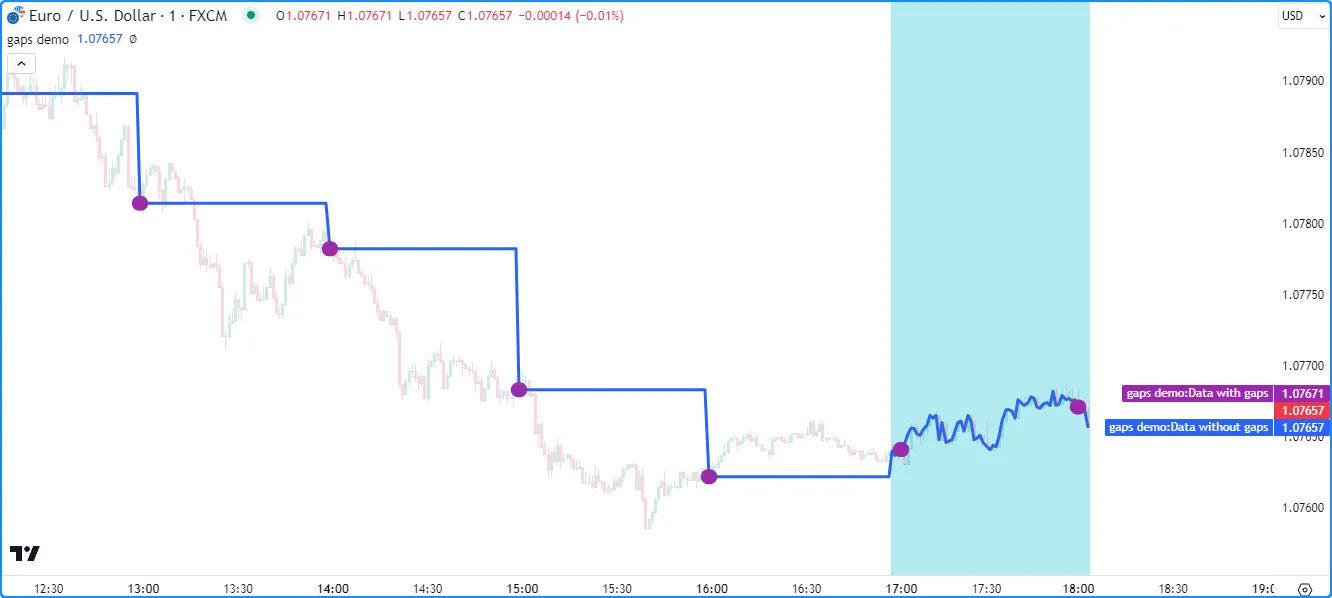
下面的脚本通过
绘制两个request.security()调用的结果
来演示行为的差异,这两个调用
从 1 分钟图上的每小时时间范围内
获取
当前符号的收盘gaps = barmerge.gaps_off价。第一个调用使用,第二个调用使用gaps = barmerge.gaps_on:
//@version=5
indicator("gaps demo", overlay = true)

//@variable The `close` requested from the hourly timeframe without gaps.
float dataWithoutGaps = request.security(syminfo.tickerid, "60", close, gaps = barmerge.gaps_off)
//@variable The `close` requested from the hourly timeframe with gaps.
float dataWithGaps = request.security(syminfo.tickerid, "60", close, gaps = barmerge.gaps_on)

// Plot the requested data.
plot(dataWithoutGaps, "Data without gaps", color.blue, 3, plot.style_linebr)
plot(dataWithGaps, "Data with gaps", color.purple, 15, plot.style_linebr)

// Highlight the background for realtime bars.
bgcolor(barstate.isrealtime ? color.new(color.aqua, 70) : na, title = "Realtime bar highlight")
注意:
- barmerge.gaps_off
gaps是所有适用函数中参数 的默认值request.*()。 - 该脚本将请求的系列绘制为带有断点的线条(plot.style_linebr),这些线条不会 像默认样式(plot.style_line )那样跨越na值。
- 使用barmerge.gaps_off时 , request.security()函数会返回 所有历史条形图上每小时时间范围内的 最后确认 收盘价。在实时条形图(本例中为带有color.aqua背景的条形图 )上运行时,它会返回符号的当前 收盘 价,无论确认与否。有关更多信息,请参阅 本页的历史和实时行为部分。
`忽略无效符号`
ignore_invalid_symbol函数的参数决定request.*()了函数如何处理无效的数据请求,例如:
- 使用
request.*()具有不存在的股票代码 ID 作为symbol/ticker参数的函数。 - 使用
request.financial()
检索指定
symbol或不存在的信息period。 - 使用
request.economic()
来请求
field不存在的country_code。
如果函数调用的参数为 ,则在发出错误请求时request.*()会产生运行时错误并暂停脚本的执行
。当此参数的值为 时,函数在这种情况下将返回
na
值,而不是引发错误。ignore_invalid_symbolfalsetrue
此示例使用用户定义函数request.*()中的调用
来检索用于估计工具市值(市值)的数据。用户定义函数调用
request.financial()
来检索符号的总流通股数,并
调用 request.security()来检索包含符号收盘
价和
货币
的元组
。我们在这两个
调用中都包含了这些内容,以防止无效请求导致运行时错误。calcMarketCap()ignore_invalid_symbol = truerequest.*()
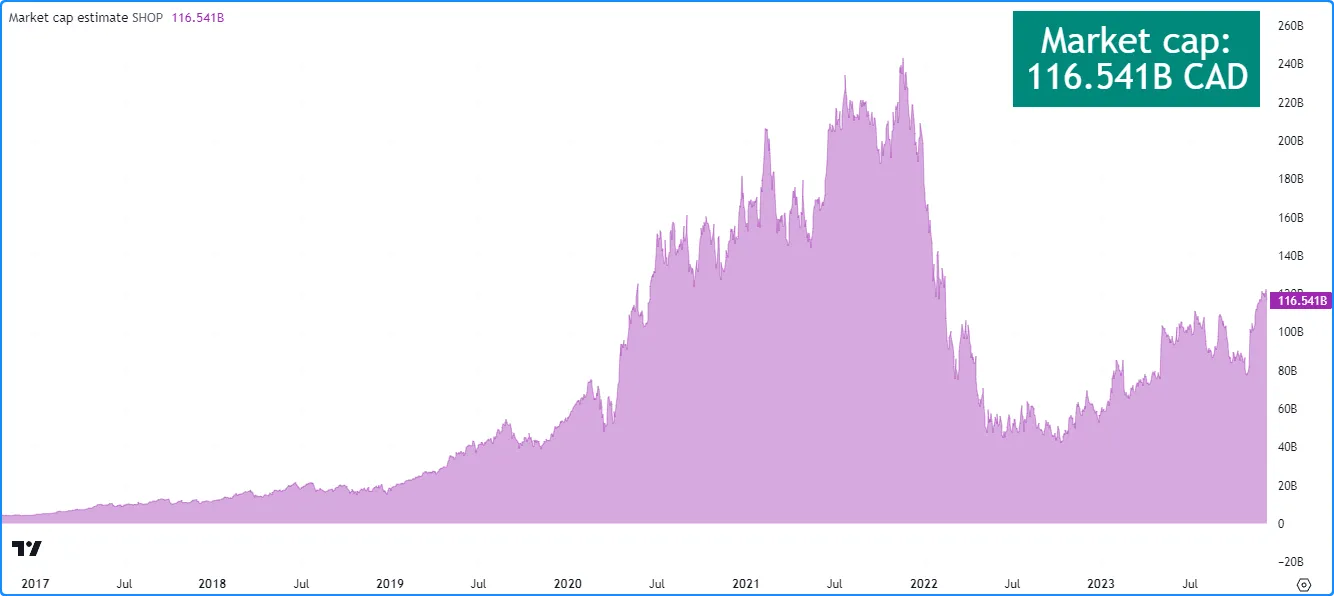
该脚本在图表上的
表格中显示一个格式化的字符串
,代表符号的估计市值和货币
,并使用图表
来可视化历史记录:marketCap
//@version=5
indicator("ignore_invalid_symbol demo", "Market cap estimate", format = format.volume)

//@variable The symbol to request data from.
string symbol = input.symbol("TSX:SHOP", "Symbol")

//@function Estimates the market capitalization of the specified `tickerID` if the data exists.
calcMarketCap(simple string tickerID) =>
    //@variable The quarterly total shares outstanding for the `tickerID`. Returns `na` when the data isn't available.
    float tso = request.financial(tickerID, "TOTAL_SHARES_OUTSTANDING", "FQ", ignore_invalid_symbol = true)
    //@variable The `close` price and currency for the `tickerID`. Returns `[na, na]` when the `tickerID` is invalid.
    [price, currency] = request.security(
         tickerID, timeframe.period, [close, syminfo.currency], ignore_invalid_symbol = true
     )
    // Return a tuple containing the market cap estimate and the quote currency.
    [tso * price, currency]

//@variable A `table` object with a single cell that displays the `marketCap` and `quoteCurrency`.
var table infoTable = table.new(position.top_right, 1, 1)
// Initialize the table's cell on the first bar.
if barstate.isfirst
    table.cell(infoTable, 0, 0, "", text_color = color.white, text_size = size.huge, bgcolor = color.teal)

// Get the market cap estimate and quote currency for the `symbol`.
[marketCap, quoteCurrency] = calcMarketCap(symbol)

//@variable The formatted text displayed inside the `infoTable`.
string tableText = str.format("Market cap:\n{0} {1}", str.tostring(marketCap, format.volume), quoteCurrency)
// Update the `infoTable`.
table.cell_set_text(infoTable, 0, 0, tableText)

// Plot the `marketCap` value.
plot(marketCap, "Market cap", color.new(color.purple, 60), style = plot.style_area)
注意:
- 该函数将仅返回具有总流通股数据的有效工具的值,例如我们为本示例选择的工具。它将返回
没有财务数据的其他工具
calcMarketCap()的市值 na ,包括外汇、加密货币和衍生品。 - 并非所有发行公司都会发布季度财务报告。如果
symbol的发行公司不按季度报告,请将此脚本中的“FQ”值更改为公司的最低报告期。 有关更多信息,请参阅request.financial()部分。 -
我们在
indicator()
和
str.tostring()调用中使用了
format.volume
,它指定图表窗格的 y 轴表示卷格式的值,并且值的“字符串”表示形式显示为卷格式的文本。
marketCap - 此脚本会创建一个 表格 并在第一个图表条上初始化其单元格,然后在后续条上更新单元格的文本 。要了解有关使用表格的更多信息,请参阅我们的用户手册中的表格页面。
`货币`
currency函数的参数允许request.*()用户指定请求数据的货币。当此参数的值与
请求上下文的syminfo.currencycurrency不同时,函数将转换请求的值以在指定的 中表示它们。此参数可以接受命名空间中的内置变量currency.*,例如
currency.JPY ,或表示ISO 4217 货币代码的“字符串” (例如“JPY”)。
请求数据的syminfo.currency
与指定数据之间的转换率
currency取决于前一天相应的“FX_IDC”每日汇率。如果没有可用的工具直接提供转换率,则该函数将使用价差符号的值来得出汇率。
`前瞻`
request.security()、
request.dividends()、
request.splits()和
request.earnings()lookahead中的参数
指定
函数调用的预测行为。其默认值为
barmerge.lookahead_off。
当从更高时间范围 (HTF) 上下文请求数据时,该
lookahead值决定函数是否可以请求超出其执行的历史条柱时间的值。换句话说,该lookahead值决定请求的数据是否可能包含历史条柱的前瞻偏差。
当从较低时间范围 (LTF) 上下文请求数据时,该
lookahead参数确定函数是否从每个图表条上的第一个或最后一个内部条(LTF 条) 请求值。
程序员在脚本中使用 lookahead 时应格外小心,即在请求更高时间范围的数据时。
使用
barmerge.lookahead_on
作为值时,请确保它不会通过将未来数据泄露到历史图表条中而lookahead损害脚本逻辑的完整性。
以下场景是在request.*()调用中可以启用前瞻的情况:
- request.security ()
expression中的 引用具有历史偏移量 的系列(例如),这可以防止函数请求它无法实时访问的未来值。close[1] - 调用中指定的
timeframe与脚本执行的图表相同,即 timeframe.period。 - 函数调用请求来自 intrabar 时间范围的数据,即小于 timeframe.period 的时间范围 。有关 更多信息,请参阅本节。
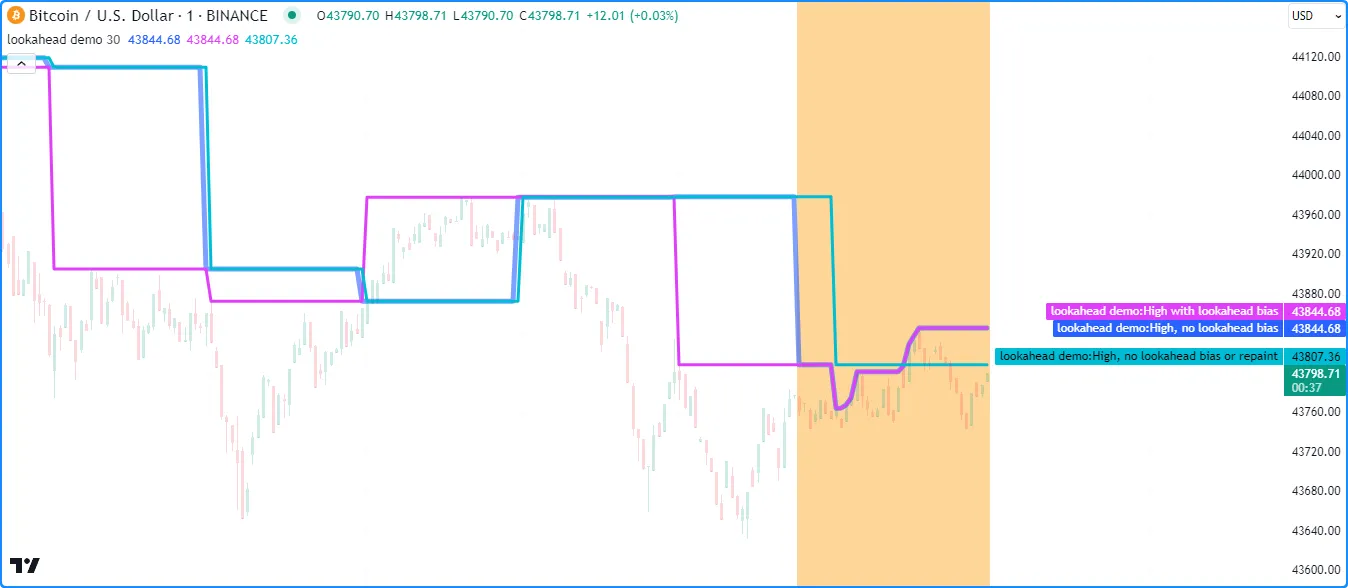
此示例演示了该lookahead参数如何影响更高时间范围数据请求的行为,以及为什么在
request.security()中启用前瞻
而不偏移expression会产生误导。脚本调用
request.security()以三种不同的方式
获取
当前图表符号的 HTF 高价,并
在图表上绘制结果系列以供比较。
第一个调用使用
barmerge.lookahead_off
(默认),其他调用使用
barmerge.lookahead_on。但是,第三个
request.security()
调用也使用历史引用运算符
[]进行偏移
,以避免将未来的数据泄露到过去。expression
正如我们在图表上看到的, 使用barmerge.lookahead_on 请求的系列 图 没有偏移(紫红色 线) 在历史条形图上实际可用之前显示 了最终的 HTF 高价,而其他两个调用则没有:
//@version=5
indicator("lookahead demo", overlay = true)

//@variable The timeframe to request the data from.
string timeframe = input.timeframe("30", "Timeframe")

//@variable The requested `high` price from the current symbol on the `timeframe` without lookahead bias.
//          On realtime bars, it returns the current `high` of the `timeframe`.
float lookaheadOff = request.security(syminfo.tickerid, timeframe, high, lookahead = barmerge.lookahead_off)

//@variable The requested `high` price from the current symbol on the `timeframe` with lookahead bias.
//          Returns values that should NOT be accessible yet on historical bars.
float lookaheadOn = request.security(syminfo.tickerid, timeframe, high, lookahead = barmerge.lookahead_on)

//@variable The requested `high` price from the current symbol on the `timeframe` without lookahead bias or repainting.
//          Behaves the same on historical and realtime bars.
float lookaheadOnOffset = request.security(syminfo.tickerid, timeframe, high[1], lookahead = barmerge.lookahead_on)

// Plot the values.
plot(lookaheadOff, "High, no lookahead bias", color.new(color.blue, 40), 5)
plot(lookaheadOn, "High with lookahead bias", color.fuchsia, 3)
plot(lookaheadOnOffset, "High, no lookahead bias or repaint", color.aqua, 3)
// Highlight the background on realtime bars.
bgcolor(barstate.isrealtime ? color.new(color.orange, 60) : na, title = "Realtime bar highlight")
注意:
- 使用barmerge.lookahead_off请求的系列 在每个 HTF 周期结束 时都有一个新的历史值,而使用 barmerge.lookahead_on请求的两个系列在每个周期开始 时都有新的历史数据。
- 在实时条形图上,无前瞻系列(蓝色)和有前瞻且无历史偏移的系列(紫红色)的绘图显示相同的值(即 HTF 期间未确认的 高价 ),因为这些点之外不存在任何数据可以泄漏到过去。这两个绘图都将在重新启动脚本执行后 重新绘制其结果,因为实时 条形图将成为 历史 条形图。
- 使用前瞻和历史偏移 ( aqua )的系列不会重绘其值,因为它始终引用 更高时间范围内的 最后确认值。有关更多信息,请参阅本页的避免重绘部分。
数据馈送
TradingView 的数据提供商提供不同的数据源,脚本可以访问这些数据源来检索有关工具的信息,其中包括:
- 日内历史数据(时间范围小于 1 天)
- 每日收盘(EOD)历史数据(时间范围 >= 1D)
- 实时数据(可能会延迟,具体取决于您的帐户类型和额外的数据服务)
- 延长营业时间数据
并非所有这些数据馈送类型都适用于每种工具。例如,符号“BNC:BLX”仅具有 EOD 数据可用。
对于某些具有日内和日外历史数据的工具,交易量数据可能不相同,因为某些交易(大宗交易、场外交易等)可能仅在交易日结束时可用。因此,日外数据将包含此交易量数据,但日内数据则不会。对于加密货币等工具,日外数据和日内交易量数据之间的差异几乎不存在,但在股票中却很常见。
EOD 和盘中数据之间也可能出现轻微的价格差异。例如,一个 EOD 柱状图上的高值可能与数据提供商当天提供的任何盘中高值不匹配。
EOD 和日内数据馈送之间的另一个区别是,EOD 馈送不包含延长时段的信息。
使用函数检索实时条形图信息时request.*()
,需要注意的是,某一工具的历史数据和实时数据报告通常依赖于不同的数据馈送。经纪商/交易所可能会追溯修改实时条形图报告的值,而这些数据只有在刷新图表或重新启动脚本执行后才会反映出来。
另一个重要的考虑因素是图表的数据馈送和脚本从提供商处请求的馈送由 独立的并发进程管理。因此,在极少数情况下,可能会发生竞争,请求的结果暂时与实时条形图上的图表不同步,脚本在重新启动执行后会进行追溯调整。
这些点可能解释了函数从其他上下文请求数据时检索到的值的变化
request.*()。它们还可能导致实时条和历史条上收到的数据不一致。对于人们在请求的数据馈送中可能遇到的变化,没有固定的规则。
当使用从其他上下文请求的数据馈送时,考虑脚本执行的图表与请求的馈送之间的时间轴request.*()差异也至关重要,因为函数会将返回的系列调整到图表的时间轴。例如,使用
request.security()请求“SPY”图表上的“BTCUSD”数据
,只有当“SPY”图表也有新数据时才会显示新值。由于“SPY”不是 24 小时符号,因此返回的“BTCUSD”数据将包含直接查看其图表时不存在的缺口。
`request.security()`
request.security () 函数允许脚本从脚本执行的图表以外的其他上下文请求数据,例如:
- 其他符号,包括价差符号
- 其他时间范围(请参阅我们的用户手册中的 时间范围页面,了解 Pine Script™ 中的时间范围规格)
ticker.*()使用函数自定义上下文,包括备选会话、价格调整、图表类型等
这是该函数的签名:
request.security(symbol, timeframe, expression, gaps, lookahead, ignore_invalid_symbol, currency, calc_bars_count) → series <type>该symbol值是代表要从中获取数据的代码的股票标识符。此参数接受以下任意格式的值:
- 表示符号(例如“IBM”或“EURUSD”)或“交易所:符号”对(例如“NYSE:IBM”或“OANDA:EURUSD”)的“字符串”。当值不包含交易所前缀时,函数会自动选择交易所。我们建议尽可能指定交易所前缀以获得一致的结果。用户还可以将空字符串传递给此参数,以提示函数使用当前图表的符号。
- 表示价差符号的“字符串” (例如“AMD/INTC”)。请注意,“条形图重放”模式不适用于这些符号。
- syminfo.ticker
或
syminfo.tickerid
内置变量,返回当前图表引用的符号或“交易所:符号”对。我们建议使用
syminfo.tickerid以避免歧义,除非
交易所信息在数据请求中无关紧要。有关变量的更多信息,请参阅
我们图表信息页面的此部分
。
syminfo.* - 使用函数创建的自定义股票代码标识符
ticker.*()。由这些函数构造的股票代码 ID 可能包含使用 非标准图表计算、替代会话和其他上下文请求数据的其他设置。 有关更多信息,请参阅自定义上下文部分。
该timeframe值指定请求数据的时间范围。此参数接受我们
时间范围规范格式的“字符串”值(例如,“1D”值代表每日时间范围)。要从与脚本执行的图表相同的时间范围内请求数据,请使用
timeframe.period
变量或空字符串。
request.security()expression函数的参数
决定
了它从指定上下文中检索的数据。这个多功能参数接受
int、
float、
bool、
color、
string和chart.point类型的“系列”值。它还可以接受
tuple、
collections、
用户定义类型以及函数和
方法调用的输出。有关可以检索的数据的更多详细信息,请参阅
下面的可请求数据部分。
时间范围
request.security
()
函数可从任何可用时间范围请求数据,无论脚本在哪个图表上执行。检索到的数据的时间范围取决于timeframe函数调用中的参数,该参数可能表示更高的时间范围(例如,在日内图表上运行脚本时使用“1D”作为值timeframe
)或图表的时间范围(即使用
timeframe.period
或空字符串作为参数timeframe)。
脚本还可以使用request.security()请求较低时间范围内的有限数据
(例如,在 60 分钟图表上运行脚本时使用“1”作为参数)。但是,我们通常不建议将此函数用于 LTF 数据请求。
对于此类情况, request.security_lower_tf()
函数更为理想。timeframe
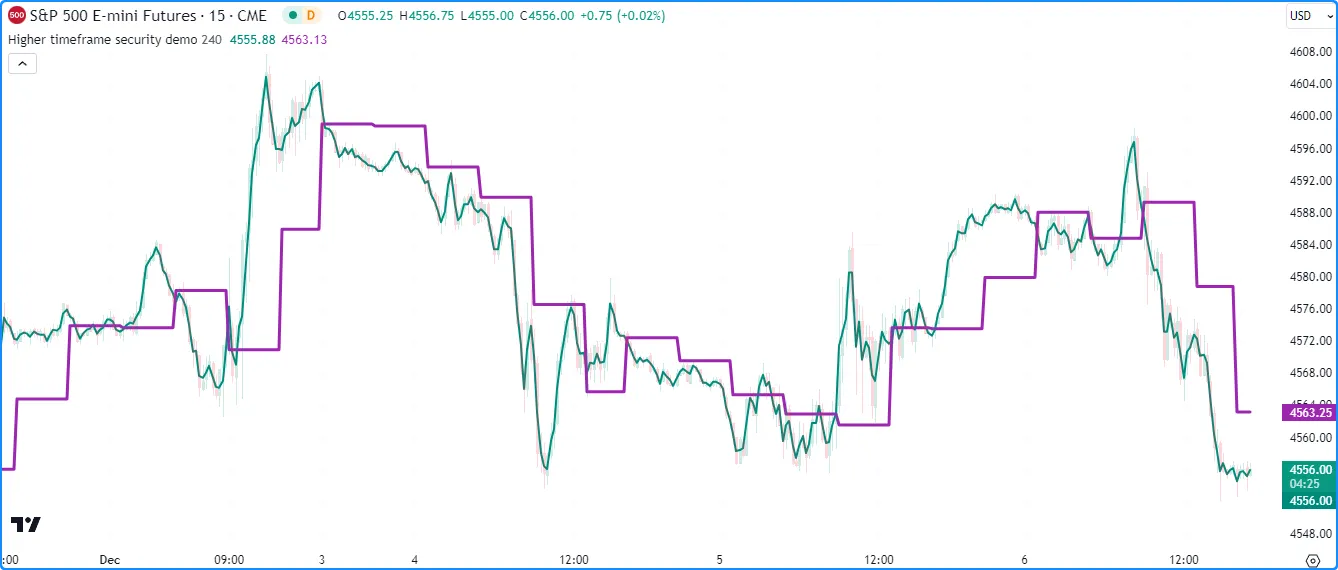
更高的时间范围
request.security()的大多数用例
涉及请求高于或等于图表时间范围的数据。例如,此脚本
从请求中检索hl2higherTimeframe价格。它将
结果系列与当前图表的hl2一起绘制在图表上
以供比较:
//@version=5
indicator("Higher timeframe security demo", overlay = true)

//@variable The higher timeframe to request data from.
string higherTimeframe = input.timeframe("240", "Higher timeframe")

//@variable The `hl2` value from the `higherTimeframe`. Combines lookahead with an offset to avoid repainting.
float htfPrice = request.security(syminfo.tickerid, higherTimeframe, hl2[1], lookahead = barmerge.lookahead_on)

// Plot the `hl2` from the chart timeframe and the `higherTimeframe`.
plot(hl2, "Current timeframe HL2", color.teal, 2)
plot(htfPrice, "Higher timeframe HL2", color.purple, 3)
注意:
- 我们在参数中添加了一个偏移量
expression,并 在 request.security()中使用了barmerge.lookahead_on ,以确保返回的序列在历史和实时条形图上的行为相同。 有关更多信息,请参阅避免重绘部分。
请注意,在上面的例子中,可以选择一个
实际上代表比图表使用的时间范围更低的higherTimeframe值
,因为代码不会阻止它。在设计专门用于更高时间范围的脚本时,我们建议加入条件以防止其访问更低的时间范围,特别是如果您打算
发布它时。
下面,我们在前面的示例中添加了一个
if结构,
当输入表示的时间范围小于图表时间范围时,会引发运行时错误,从而有效地阻止脚本请求 LTF 数据:higherTimeframe
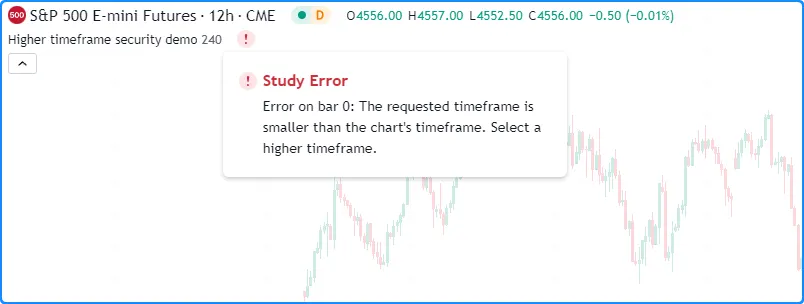
//@version=5
indicator("Higher timeframe security demo", overlay = true)

//@variable The higher timeframe to request data from.
string higherTimeframe = input.timeframe("240", "Higher timeframe")

// Raise a runtime error when the `higherTimeframe` is smaller than the chart's timeframe.
if timeframe.in_seconds() > timeframe.in_seconds(higherTimeframe)
    runtime.error("The requested timeframe is smaller than the chart's timeframe. Select a higher timeframe.")

//@variable The `hl2` value from the `higherTimeframe`. Combines lookahead with an offset to avoid repainting.
float htfPrice = request.security(syminfo.tickerid, higherTimeframe, hl2[1], lookahead = barmerge.lookahead_on)

// Plot the `hl2` from the chart timeframe and the `higherTimeframe`.
plot(hl2, "Current timeframe HL2", color.teal, 2)
plot(htfPrice, "Higher timeframe HL2", color.purple, 3)
较低的时间范围
尽管
request.security()
函数旨在在大于或等于图表时间范围的时间范围内运行,但它也可以expression从较低的时间范围请求数据,但有限制。当调用此函数访问较低的时间范围时,它将从 LTF 上下文中评估。但是,它只能返回每个图表条上的单个内部条(LTF 条)的结果。
函数在每个历史图表条形图上返回数据的 intrabar 取决于lookahead函数调用中的值。使用
barmerge.lookahead_on时,它将返回图表周期中
第一个可用的 intrabar。使用barmerge.lookahead_off时,它将返回图表周期中的最后一个intrabar。在实时条形图上,它会返回时间范围内的最后一个可用值expression,无论值如何lookahead,因为函数检索到的实时 intrabar 信息尚未排序。
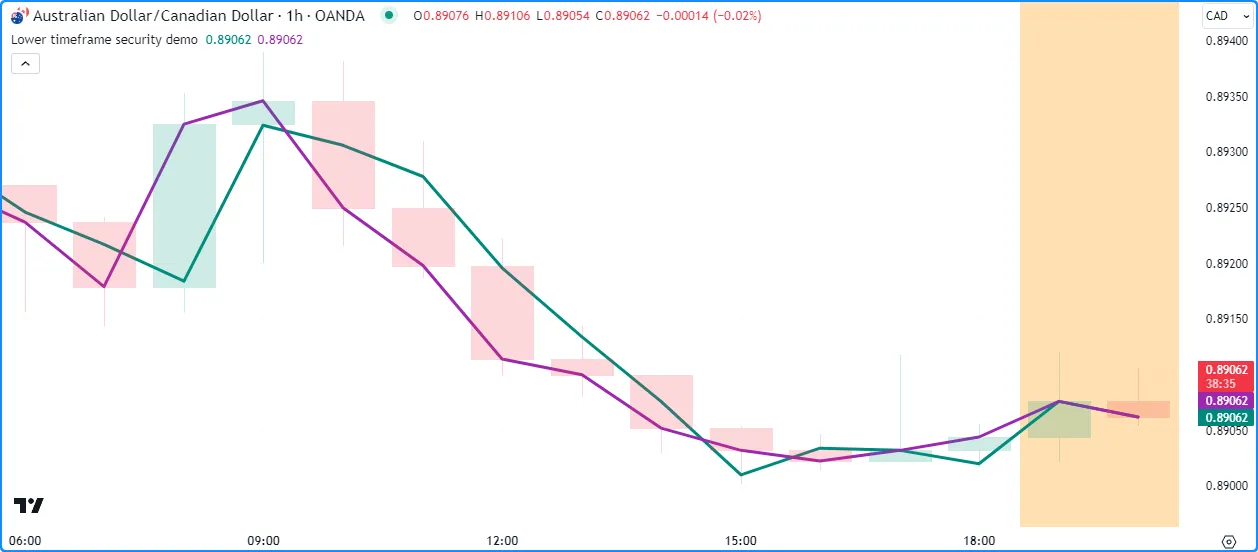
此脚本
从最接近图表时间范围大小四分之一的有效时间范围内
检索收盘数据。它使用
不同的值对request.security()lookahead进行两次调用。第一次调用使用
barmerge.lookahead_on
访问每个图表条中的第一个内部条值。第二次调用使用默认lookahead值 ( barmerge.lookahead_off ),它请求分配给每个图表条的最后一个内部条值。脚本在图表上绘制两次调用的输出以比较差异:
//@version=5
indicator("Lower timeframe security demo", overlay = true)

//@variable The valid timeframe closest to 1/4 the size of the chart timeframe.
string lowerTimeframe = timeframe.from_seconds(int(timeframe.in_seconds() / 4))

//@variable The `close` value on the `lowerTimeframe`. Represents the first intrabar value on each chart bar.
float firstLTFClose = request.security(syminfo.tickerid, lowerTimeframe, close, lookahead = barmerge.lookahead_on)
//@variable The `close` value on the `lowerTimeframe`. Represents the last intrabar value on each chart bar.
float lastLTFClose = request.security(syminfo.tickerid, lowerTimeframe, close)

// Plot the values.
plot(firstLTFClose, "First intrabar close", color.teal, 3)
plot(lastLTFClose, "Last intrabar close", color.purple, 3)
// Highlight the background on realtime bars.
bgcolor(barstate.isrealtime ? color.new(color.orange, 70) : na, title = "Realtime background highlight")
注意:
- 该脚本通过使用timeframe.in_seconds()
lowerTimeframe计算图表时间范围内的秒数 来确定值,然后除以四并 通过 timeframe.from_seconds()将结果转换为有效的时间范围字符串。 - 没有前瞻的系列图(紫色)与 图表时间范围内的收盘值对齐 ,因为这是图表条中的最后一个条内值。
- 两个 request.security() 调用都会在每个实时条形图上返回相同的值(当前 收盘价) ,如橙色背景 的条形图上所示 。
- 脚本可以从较低时间范围的上下文中检索最多 100,000 个内部条形图。请参阅 限制页面的 此部分 。
可请求的数据
request.security()函数
用途广泛,因为它可以检索任何基本类型(int、float、bool、color或string)的值。它还可以请求引用基本类型的数据结构和内置或
用户定义类型的 ID 。此函数请求的数据取决于其expression参数,该参数接受以下任何参数:
内置变量和函数
request.security()的一个常见用例 是从另一个符号或时间范围 请求内置变量或函数/方法调用的输出。
例如,假设我们想在日内图上计算 某个符号 ohlc4价格在日线时间范围内的 20 条SMA 。我们可以用一行代码完成此操作:
float ma = request.security(syminfo.tickerid, "1D", ta.sma(ohlc4, 20))
上面这一行根据每日时间范围计算当前符号的ta.sma(ohlc4, 20)的值。
值得注意的是,Pine 的新手有时可能会混淆上面的代码行,认为它等同于下面的代码行:
float ma = ta.sma(request.security(syminfo.tickerid, "1D", ohlc4), 20)
但是,此行将返回完全不同的结果。它不是从每日时间范围内请求 20 条 SMA,而是 从每日时间范围内 请求ohlc4价格,并计算 20 条图表条形图 结果的ta.sma()。
本质上,当意图从其他上下文请求表达式的结果时,将表达式直接传递给
request.security()expression调用中的参数
,如最初的示例所示。
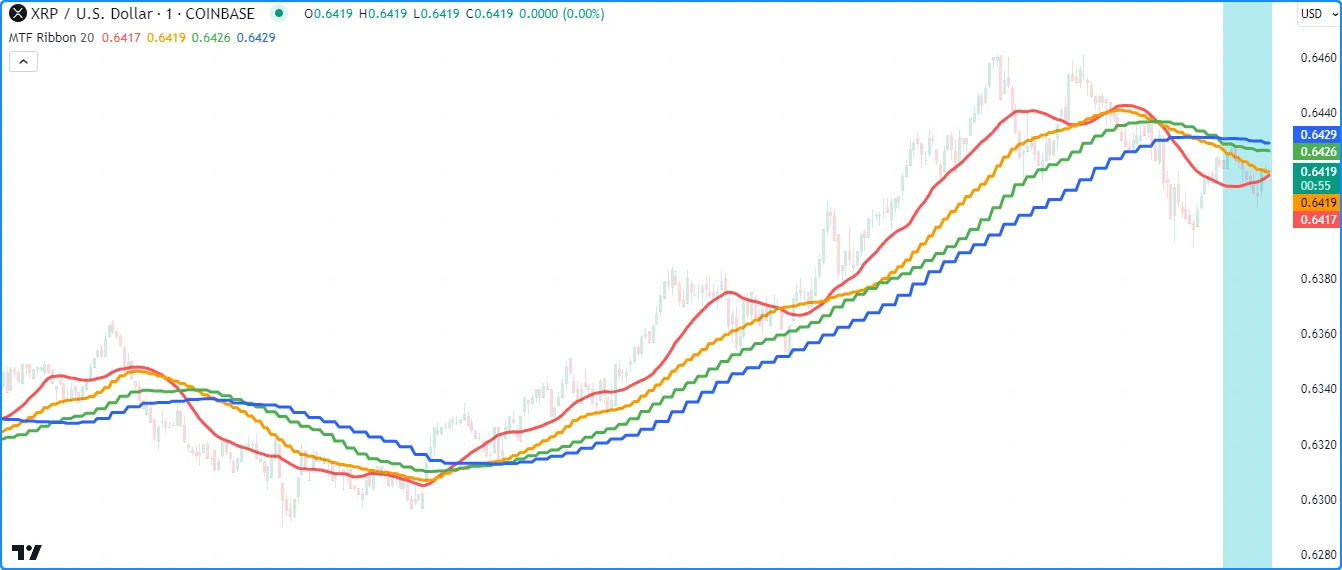
让我们扩展这个概念。下面的脚本计算多时间范围 (MTF) 移动平均线带,其中带中的每个移动平均线在其各自的时间范围内计算相同数量的条形图。每个
request.security()
调用都使用ta.sma(close, length)
作为expression参数来返回length指定时间范围内的 -bar SMA:
//@version=5
indicator("Requesting built-ins demo", "MTF Ribbon", true)

//@variable The length of each moving average.
int length = input.int(20, "Length", 1)

//@variable The number of seconds in the chart timeframe.
int chartSeconds = timeframe.in_seconds()

// Calculate the higher timeframes closest to 2, 3, and 4 times the size of the chart timeframe.
string htf1 = timeframe.from_seconds(chartSeconds * 2)
string htf2 = timeframe.from_seconds(chartSeconds * 3)
string htf3 = timeframe.from_seconds(chartSeconds * 4)

// Calculate the `length`-bar moving averages from each timeframe.
float chartAvg = ta.sma(ohlc4, length)
float htfAvg1  = request.security(syminfo.tickerid, htf1, ta.sma(ohlc4, length))
float htfAvg2  = request.security(syminfo.tickerid, htf2, ta.sma(ohlc4, length))
float htfAvg3  = request.security(syminfo.tickerid, htf3, ta.sma(ohlc4, length))

// Plot the results.
plot(chartAvg, "Chart timeframe SMA", color.red, 3)
plot(htfAvg1, "Double timeframe SMA", color.orange, 3)
plot(htfAvg2, "Triple timeframe SMA", color.green, 3)
plot(htfAvg3, "Quadruple timeframe SMA", color.blue, 3)

// Highlight the background on realtime bars.
bgcolor(barstate.isrealtime ? color.new(color.aqua, 70) : na, title = "Realtime highlight")
注意:
- 该脚本通过将图表的 timeframe.in_seconds() 值乘以 2、3 和 4 来计算功能区的更高时间范围,然后 使用 timeframe.from_seconds()将每个结果转换为有效的时间范围字符串。
- 无需
在每个
request.security()调用中调用ta.sma()
,只需在每个调用中使用该变量即可
获得相同的结果。
有关更多信息,请参阅下一节。
chartAvgexpression - 在实时条形图上,此脚本还会跟踪每个较高时间范围内 未确认的SMA 值。请参阅历史和实时行为部分以了解更多信息。
计算变量
request.security()expression的参数
接受
在全局范围内声明的变量,允许脚本从其他上下文评估其变量的计算,而无需在每个函数调用中冗余地列出操作。
例如,可以声明以下变量:
priceReturn = (close - close[1]) / close[1]
并使用request.security()从另一个上下文执行变量的计算 :
requestedReturn = request.security(symbol, timeframe.period, priceReturn)
上面一行中的函数调用将返回
priceReturn对另一个symbol数据的计算结果作为适合当前图表的系列,脚本可以直接在图表上显示该结果或在其他操作中使用。
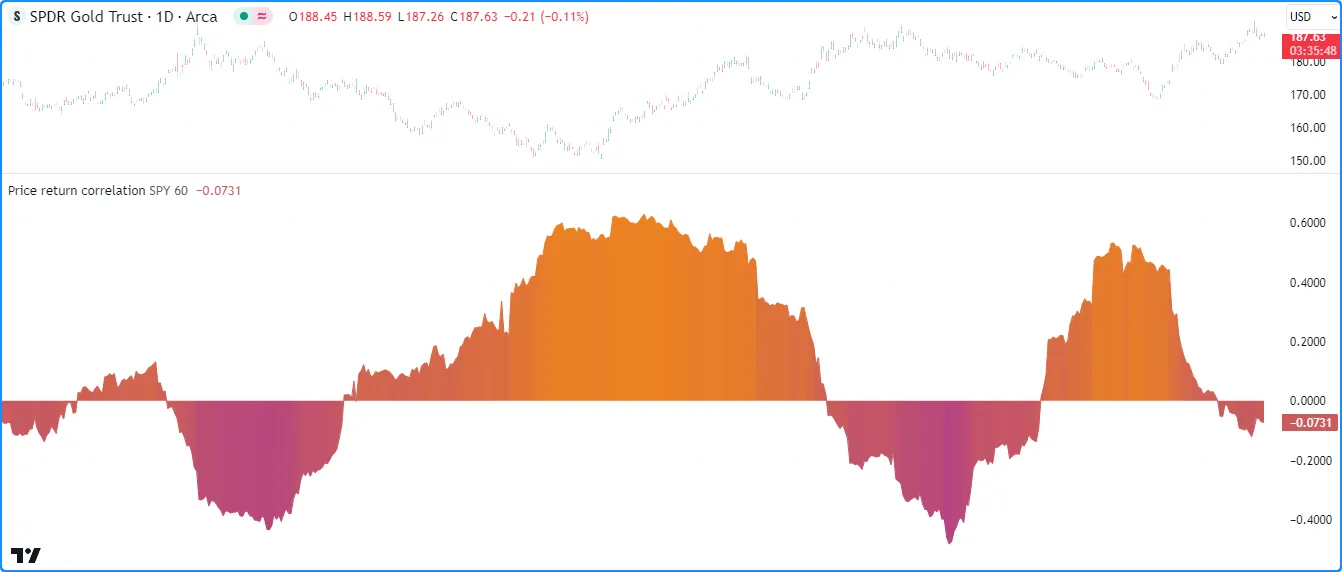
以下示例比较当前图表符号和另一个指定 的价格回报symbol。脚本
priceReturn从图表上下文中声明变量,然后在
request.security()中使用该变量
来评估其对另一个 的计算symbol。然后,它计算
和
之间的相关性,并
在图表上绘制结果:priceReturnrequestedReturn
//@version=5
indicator("Requesting calculated variables demo", "Price return correlation")

//@variable The symbol to compare to the chart symbol.
string symbol = input.symbol("SPY", "Symbol to compare")
//@variable The number of bars in the calculation window.
int length = input.int(60, "Length", 1)

//@variable The close-to-close price return.
float priceReturn = (close - close[1]) / close[1]
//@variable The close-to-close price return calculated on another `symbol`.
float requestedReturn = request.security(symbol, timeframe.period, priceReturn)

//@variable The correlation between the `priceReturn` and `requestedReturn` over `length` bars.
float correlation = ta.correlation(priceReturn, requestedReturn, length)
//@variable The color of the correlation plot.
color plotColor = color.from_gradient(correlation, -1, 1, color.purple, color.orange)

// Plot the correlation value.
plot(correlation, "Correlation", plotColor, style = plot.style_area)
注意:
- request.security
()
调用执行与声明中相同的计算
priceReturn,但它使用 从输入中获取的接近symbol值。 -
该脚本根据值使用渐变色为图表着色
correlation。要了解有关 Pine 中颜色渐变的更多信息,请参阅 我们用户手册中有关颜色的页面的 此部分。
元组
Pine Script™ 中的元组是用逗号分隔的括号中的表达式集,可以容纳任何可用类型的多个值。我们在创建返回多个值的函数或其他本地块时使用元组。
request.security
()
函数可以接受元组作为其expression参数,从而允许脚本使用单个函数调用请求多个不同类型的系列。请求的元组中的表达式可以是
本页可请求数据部分中列出的任何类型,但不包括其他元组。
当脚本需要从特定上下文中检索多个值时,元组特别方便。
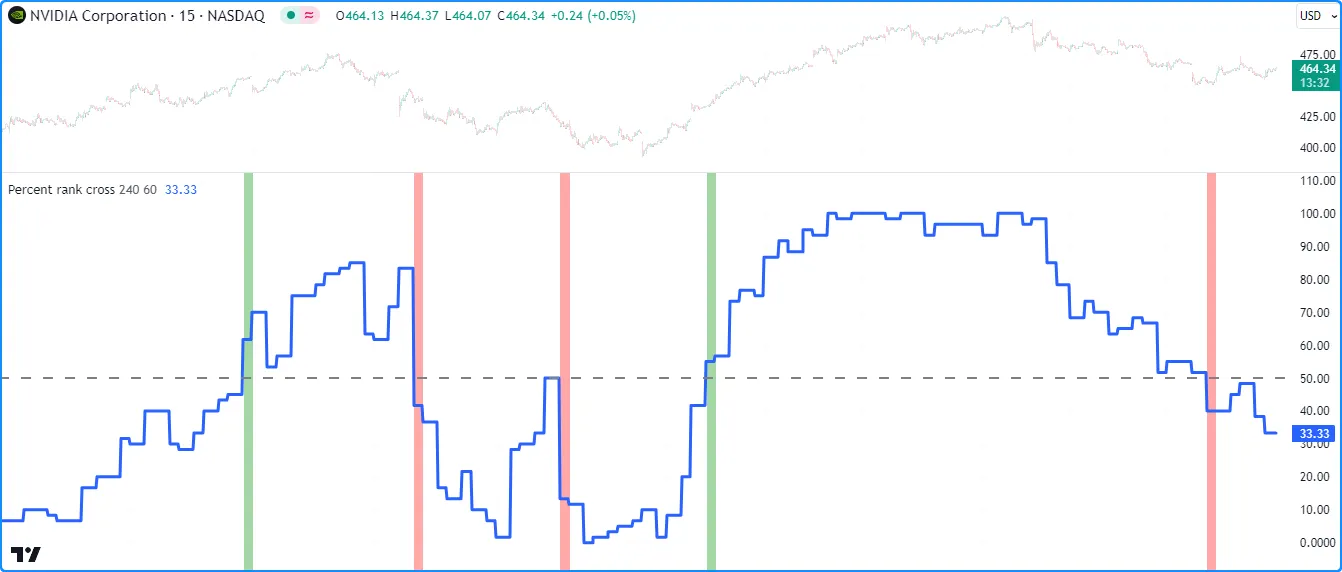
例如,此脚本计算收盘
价在柱状图上
的
百分比排名,并将表达式分配给变量
。然后,它调用
request.security()来
从指定的
请求包含、ta.crossover(rank, 50)和ta.crossunder(rank, 50)值的元组。该脚本
绘制
并使用bgcolor()中的和“bool”值
有条件地突出显示图表窗格的背景:lengthrankranktimeframerequestedRankcrossOvercrossUnder
//@version=5
indicator("Requesting tuples demo", "Percent rank cross")

//@variable The timeframe of the request.
string timeframe = input.timeframe("240", "Timeframe")
//@variable The number of bars in the calculation.
int length = input.int(20, "Length")

//@variable The previous bar's percent rank of the `close` price over `length` bars.
float rank = ta.percentrank(close, length)[1]

// Request the `rank` value from another `timeframe`, and two "bool" values indicating the `rank` from the `timeframe`
// crossed over or under 50.
[requestedRank, crossOver, crossUnder] = request.security(
     syminfo.tickerid, timeframe, [rank, ta.crossover(rank, 50), ta.crossunder(rank, 50)],
     lookahead = barmerge.lookahead_on
 )

// Plot the `requestedRank` and create a horizontal line at 50.
plot(requestedRank, "Percent Rank", linewidth = 3)
hline(50, "Cross line", linewidth = 2)
// Highlight the background of all bars where the `timeframe`'s `crossOver` or `crossUnder` value is `true`.
bgcolor(crossOver ? color.new(color.green, 50) : crossUnder ? color.new(color.red, 50) : na)
注意:
rank我们使用历史引用运算符 []将变量的表达式偏移了一个条形图 ,并 在 request.security()调用中包含了barmerge.lookahead_on ,以确保实时条形图上的值在成为历史条形图后不会重新绘制。有关更多信息,请参阅 避免重新绘制部分。- request.security
()
调用返回一个元组,因此我们使用元组声明来声明
requestedRank、crossOver和crossUnder变量。要了解有关使用元组的更多信息,请参阅 我们用户手册的 类型系统 页面的此部分。
用户定义函数
用户定义函数和
方法
是由用户编写的自定义函数。它们允许用户定义与标识符关联的操作序列,脚本可以在执行过程中方便地调用这些操作序列(例如myUDF())。
request.security ()函数可以请求用户定义的函数和 方法 的结果 ,其范围由本页的 可请求数据部分概述的任何类型组成。
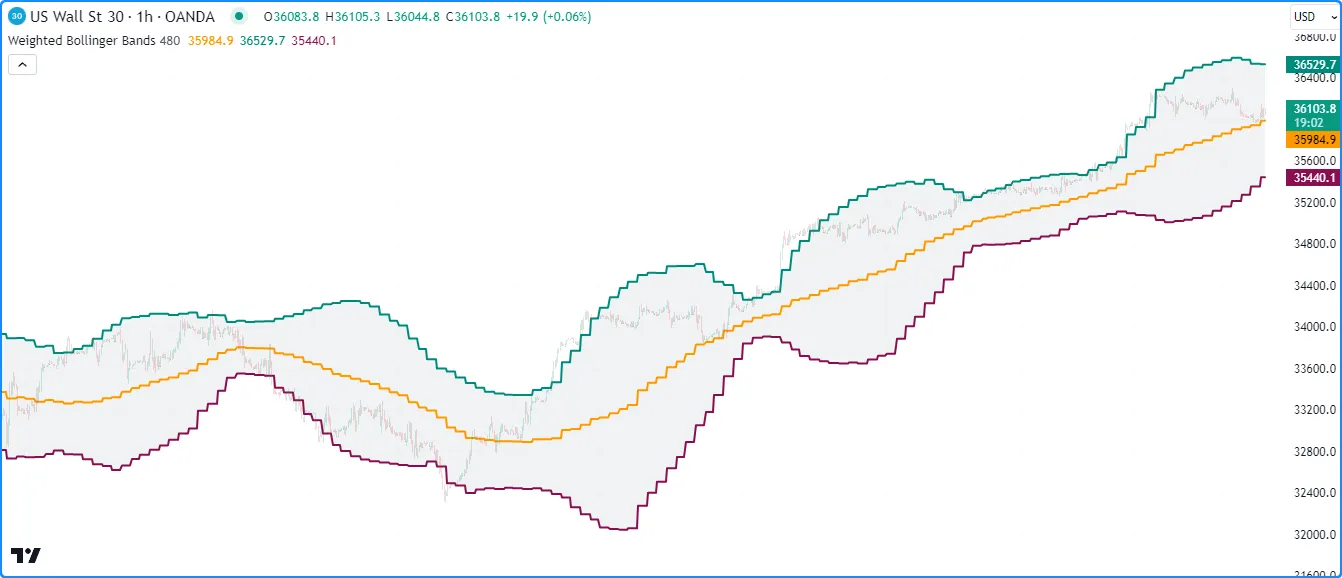
例如,此脚本包含一个用户定义weightedBB()函数,该函数使用由指定系列加权的基准平均值来计算布林带weight。该函数返回
自定义带值元组。脚本调用request.security()
中的参数
weightedBB()来
检索
根据指定计算的带值元组,并
在图表上绘制结果:expressiontimeframe
//@version=5
indicator("Requesting user-defined functions demo", "Weighted Bollinger Bands", true)

//@variable The timeframe of the request.
string timeframe = input.timeframe("480", "Timeframe")

//@function     Calculates Bollinger Bands with a custom weighted basis.
//@param source The series of values to process.
//@param length The number of bars in the calculation.
//@param mult   The standard deviation multiplier.
//@param weight The series of weights corresponding to each `source` value.
//@returns      A tuple containing the basis, upper band, and lower band respectively.
weightedBB(float source, int length, float mult = 2.0, float weight = 1.0) =>
    //@variable The basis of the bands.
    float ma = math.sum(source * weight, length) / math.sum(weight, length)
    //@variable The standard deviation from the `ma`.
    float dev = 0.0
    // Loop to accumulate squared error.
    for i = 0 to length - 1
        difference = source[i] - ma
        dev += difference * difference
    // Divide `dev` by the `length`, take the square root, and multiply by the `mult`.
    dev := math.sqrt(dev / length) * mult
    // Return the bands.
    [ma, ma + dev, ma - dev]

// Request weighted bands calculated on the chart symbol's prices over 20 bars from the
// last confirmed bar on the `timeframe`.
[basis, highBand, lowBand] = request.security(
     syminfo.tickerid, timeframe, weightedBB(close[1], 20, 2.0, (high - low)[1]), lookahead = barmerge.lookahead_on
 )

// Plot the values.
basisPlot = plot(basis, "Basis", color.orange, 2)
upperPlot = plot(highBand, "Upper", color.teal, 2)
lowerPlot = plot(lowBand, "Lower", color.maroon, 2)
fill(upperPlot, lowerPlot, color.new(color.gray, 90), "Background")
注意:
- 我们在
request.security()中偏移了用作 的调用中的
source和weight参数 ,并使用了 barmerge.lookahead_on来确保请求的结果反映了实时条形图中 最后确认的值。请参阅此部分以了解更多信息。weightedBB()expressiontimeframe
图表要点
图表点是表示图表上坐标的引用类型。 线、 框、 折线和标签 使用 chart.point 对象来设置其显示位置。
request.security
()函数可以
在其参数中使用chart.point实例
的 ID
expression,允许脚本从其他上下文中检索图表坐标。
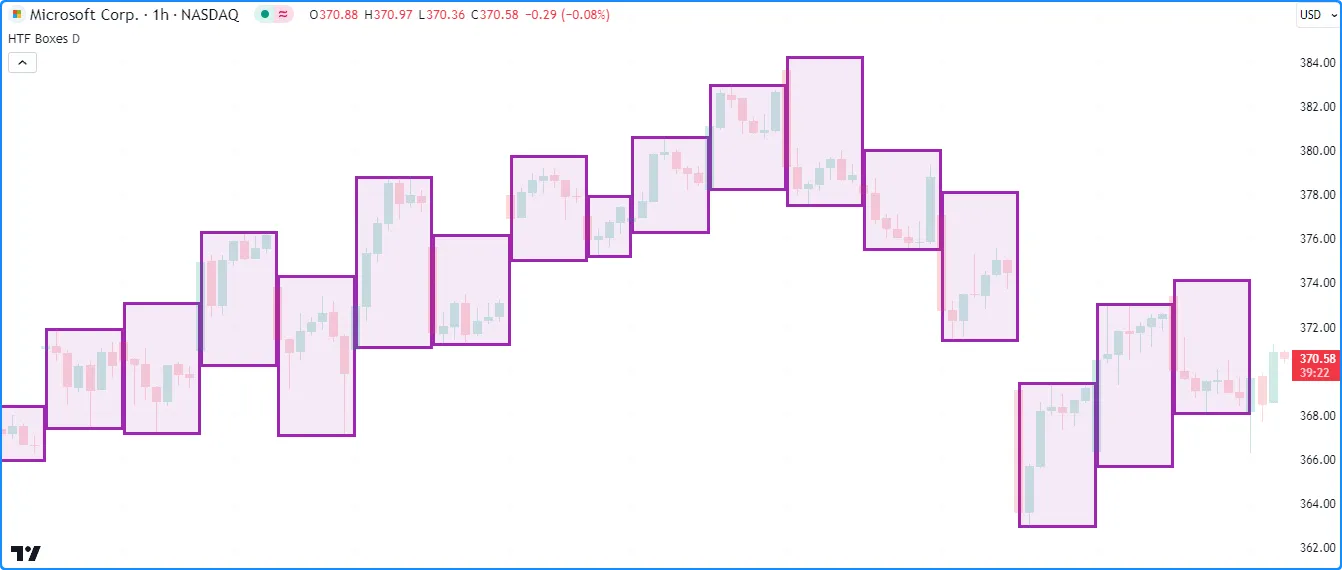
下面的示例请求更高时间范围内的历史
图表点元组,并使用它们在图表上绘制
框。脚本声明引用
最后确认的条形图
的chart.pointtopLeft ID 的和bottomRight变量
。然后,它使用request.security()
请求
包含代表和的
图表点ID 的
元组。topLeftbottomRighthigherTimeframe
当在 上开始新的条形图时higherTimeframe,脚本将
使用和坐标从和
图表点绘制一个新框:timepricerequestedTopLeftrequestedBottomRight
//@version=5
indicator("Requesting chart points demo", "HTF Boxes", true, max_boxes_count = 500)

//@variable The timeframe to request data from.
string higherTimeframe = input.timeframe("1D", "Timeframe")

// Raise a runtime error if the `higherTimeframe` is smaller than the chart's timeframe.
if timeframe.in_seconds(higherTimeframe) < timeframe.in_seconds(timeframe.period)
    runtime.error("The selected timeframe is too small. Choose a higher timeframe.")

//@variable A `chart.point` containing top-left coordinates from the last confirmed bar.
topLeft = chart.point.now(high)[1]
//@variable A `chart.point` containing bottom-right coordinates from the last confirmed bar.
bottomRight = chart.point.from_time(time_close, low)[1]

// Request the last confirmed `topLeft` and `bottomRight` chart points from the `higherTimeframe`.
[requestedTopLeft, requestedBottomRight] = request.security(
     syminfo.tickerid, higherTimeframe, [topLeft, bottomRight], lookahead = barmerge.lookahead_on
 )

// Draw a new box when a new `higherTimeframe` bar starts.
// The box uses the `time` fields from the `requestedTopLeft` and `requestedBottomRight` as x-coordinates.
if timeframe.change(higherTimeframe)
    box.new(
         requestedTopLeft, requestedBottomRight, color.purple, 3,
         xloc = xloc.bar_time, bgcolor = color.new(color.purple, 90)
     )
注意:
- 由于此示例是专门为更高的时间范围设计的,因此我们包含了一个自定义运行时错误,当timeframe.in_seconds()
小于
higherTimeframe图表的时间范围 时,脚本会引发该 错误。
收藏
Pine Script™集合(数组和映射)是包含任意数量具有指定类型的元素的数据结构。 request.security()函数可以检索元素包含以下内容的集合 的 ID :
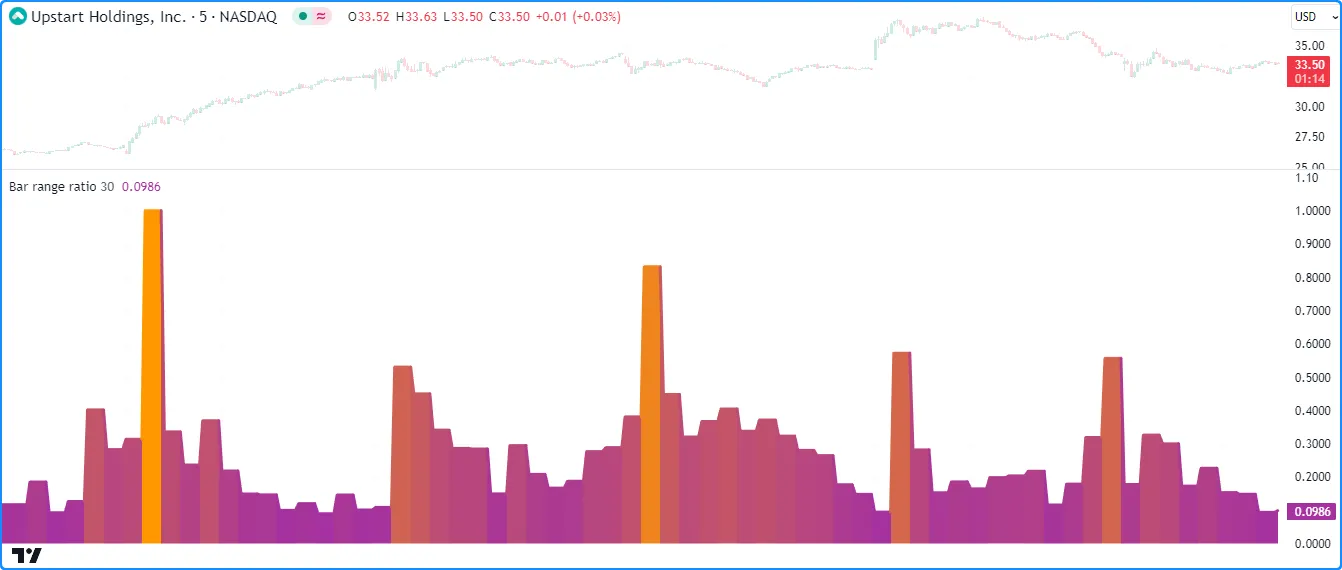
此示例计算已确认条形图的高低范围与
从指定和开始的 10 条条形图的最高值
和
最低值之间的范围的比率。它使用
映射来保存计算中使用的值。symboltimeframe
该脚本创建一个data带有“string”键和“float”值的映射,以保存
每个条形图上的高价、
低价、
最高价和
最低expression价值,并在
request.security()中使用这些值
来计算otherData表示data指定上下文的映射。它使用与映射的“High”、“Low”、“Highest”和“Lowest”键关联的值otherData来计算图表窗格中的比例that it图:
//@version=5
indicator("Requesting collections demo", "Bar range ratio")

//@variable The ticker ID to request data from.
string symbol = input.symbol("", "Symbol")
//@variable The timeframe of the request.
string timeframe = input.timeframe("30", "Timeframe")

//@variable A map with "string" keys and "float" values.
var map<string, float> data = map.new<string, float>()

// Put key-value pairs into the `data` map.
map.put(data, "High", high)
map.put(data, "Low", low)
map.put(data, "Highest", ta.highest(10))
map.put(data, "Lowest", ta.lowest(10))

//@variable A new `map` whose data is calculated from the last confirmed bar of the requested context.
map<string, float> otherData = request.security(symbol, timeframe, data[1], lookahead = barmerge.lookahead_on)

//@variable The ratio of the context's bar range to the max range over 10 bars. Returns `na` if no data is available.
float ratio = na
if not na(otherData)
    ratio := (otherData.get("High") - otherData.get("Low")) / (otherData.get("Highest") - otherData.get("Lowest"))

//@variable A gradient color for the plot of the `ratio`.
color ratioColor = color.from_gradient(ratio, 0, 1, color.purple, color.orange)

// Plot the `ratio`.
plot(ratio, "Range Ratio", ratioColor, 3, plot.style_area)
注意:
-
如果指定上下文中没有可用数据,此脚本中的 request.security() 调用将返回 na。由于当映射变量的值为 na 时无法对其调用方法
,
因此
我们添加了
if
结构,以便
仅
在引用
有效
映射
ID 时计算新值。
ratiootherData
用户定义类型
用户定义类型 (UDT)是包含任意数量 字段的复合类型,这些字段可以是任何可用类型,包括其他 用户定义类型。
如果UDT生成的 对象的 字段包含以下内容,则 request.security() 函数可以从其他上下文中检索 这些对象 的 ID :
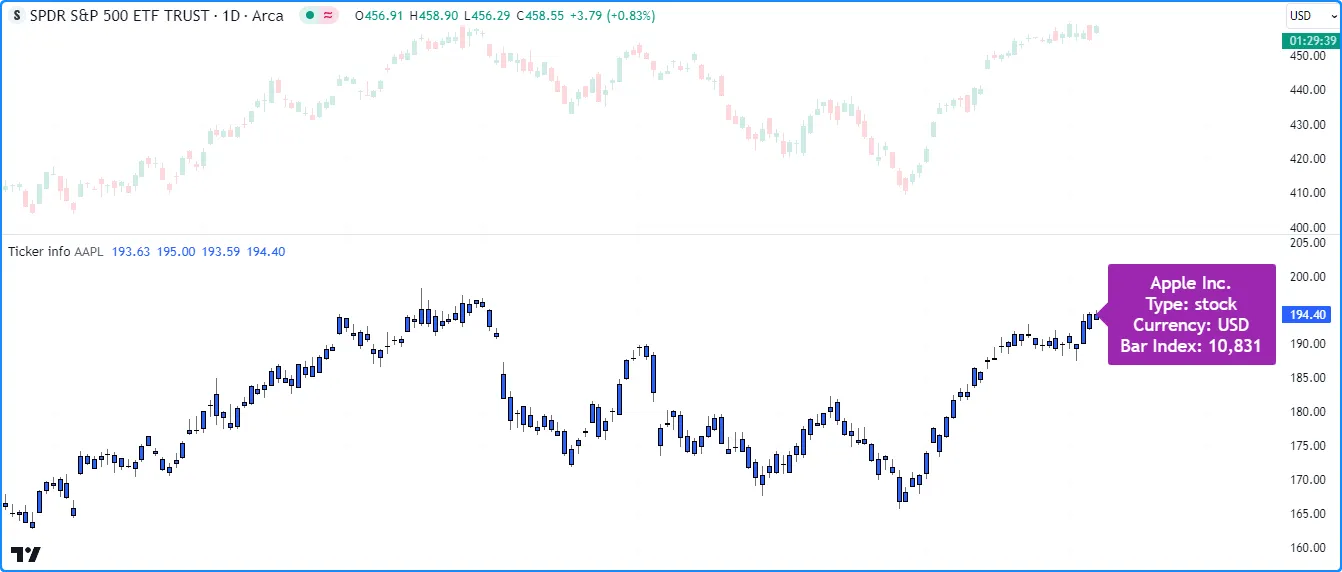
以下示例
使用指定的请求对象symbolID ,并在图表窗格上显示其字段值。
该脚本包含一个TickerInfoUDT,其中包含用于
syminfo.*值
的“字符串”字段
、用于存储最近“浮点”价格数据的
数组字段以及用于保存请求的股票行情的bar_index
值的“整数”字段。它为每个条形图上的变量分配一个新的TickerInfoID info,并使用该变量作为request.security()expression中的
,以检索表示从指定的
计算出的 的对象
的 ID 。infosymbol
该脚本在标签requestedInfo中显示对象的description、
tickerType、currency和barIndex值
,并使用
plotcandle()
显示其数组中的值:prices
//@version=5
indicator("Requesting user-defined types demo", "Ticker info")

//@variable The symbol to request information from.
string symbol = input.symbol("NASDAQ:AAPL", "Symbol")

//@type               A custom type containing information about a ticker.
//@field description  The symbol's description.
//@field tickerType   The type of ticker.
//@field currency     The symbol's currency.
//@field prices       An array of the symbol's current prices.
//@field barIndex     The ticker's `bar_index`.
type TickerInfo
    string       description
    string       tickerType
    string       currency
    array<float> prices
    int          barIndex

//@variable A `TickerInfo` object containing current data.
info = TickerInfo.new(
     syminfo.description, syminfo.type, syminfo.currency, array.from(open, high, low, close), bar_index
 )
//@variable The `info` requested from the specified `symbol`.
TickerInfo requestedInfo = request.security(symbol, timeframe.period, info)
// Assign a new `TickerInfo` instance to `requestedInfo` if one wasn't retrieved.
if na(requestedInfo)
    requestedInfo := TickerInfo.new(prices = array.new<float>(4))

//@variable A label displaying information from the `requestedInfo` object.
var infoLabel = label.new(
     na, na, "", color = color.purple, style = label.style_label_left, textcolor = color.white, size = size.large
 )
//@variable The text to display inside the `infoLabel`.
string infoText = na(requestedInfo) ? "" : str.format(
     "{0}\nType: {1}\nCurrency: {2}\nBar Index: {3}",
     requestedInfo.description, requestedInfo.tickerType, requestedInfo.currency, requestedInfo.barIndex
 )

// Set the `point` and `text` of the `infoLabel`.
label.set_point(infoLabel, chart.point.now(array.last(requestedInfo.prices)))
label.set_text(infoLabel, infoText)
// Plot candles using the values from the `prices` array of the `requestedInfo`.
plotcandle(
     requestedInfo.prices.get(0), requestedInfo.prices.get(1), requestedInfo.prices.get(2), requestedInfo.prices.get(3),
     "Requested Prices"
 )
注意:
- 此脚本中使用的变量
syminfo.*均返回“简单字符串”限定类型。但是, Pine 中的对象始终被限定为“系列”。因此,分配给info对象字段的所有值都会自动采用“系列” 限定符。 -
由于请求的数据
与主图表之间存在差异, request.security()调用可能
会返回
na 。在这种情况下,此脚本会将一个新
对象分配给 ,以防止运行时错误。
symbolTickerInforequestedInfo
`请求.security_lower_tf()`
request.security_lower_tf()函数 是request.security() 的替代方案 ,旨在可靠地从较低时间帧 (LTF) 上下文请求信息。
request.security() 可以从每个图表条中的单个内部条 (LTF 条) 检索数据, 而 request.security_lower_tf()可以 从每个图表条中所有可用的内部条中检索数据,脚本可以访问这些数据并将其用于其他计算。每次 request.security_lower_tf() 调用都可以从较低的时间范围内检索最多 100,000 个内部条。有关更多信息,请参阅 我们的限制页面的此 部分。
下面是该函数的签名,与request.security()类似 :
request.security_lower_tf(symbol, timeframe, expression, ignore_invalid_symbol, currency, ignore_invalid_timeframe, calc_bars_count) → array<type>此函数仅请求小于或等于图表时间范围的时间范围的数据。如果timeframe请求的时间范围高于图表的时间范围,则该函数将引发运行时错误或返回
na
值,具体取决于ignore_invalid_timeframe调用中的参数。此参数的默认值为false,这意味着在尝试请求 HTF 数据时它将引发错误并停止脚本的执行。
请求内部数据
Intrabar 数据可以为脚本提供额外的信息,这些信息可能不明显,或者仅通过分析图表的计时器框架上采样的数据无法获得。 request.security_lower_tf() 函数可以从 intrabar 上下文中检索许多数据类型。
在进一步了解本节之前,我们建议您先了解一下
上文request.security()部分中的可请求数据部分
,该部分提供了有关可请求数据类型的基本信息。 request.security_lower_tf()中的参数
接受该部分中讨论的大部分相同参数,但不包括对
脚本主范围内声明的集合和可变变量的直接引用。虽然它接受许多相同类型的参数,但此函数返回
数组
结果,这在解释和处理方面存在一些差异,如下所述。expression
Intrabar 数据阵列
较低的时间范围比较高的时间范围包含更多的数据点,因为新值的出现频率更高。例如,当比较 1 分钟图和 1 小时图时,1 分钟图每小时的条形图数量最多是 60 倍,具体取决于可用数据。
为了解决图表条内有多个内部条的情况,
request.security_lower_tf()
总是以数组形式返回其结果。返回数组中的元素
表示
expression从较低时间范围内检索的值,并根据每个内部条的时间戳按升序排序。
分配给返回
数组的类型模板与request.security_lower_tf()调用中传递的值类型相对应
。例如,使用“int”作为将生成一个
实例,“bool”作为将生成一个
实例,等等。expressionarray<int>expressionarray<bool>
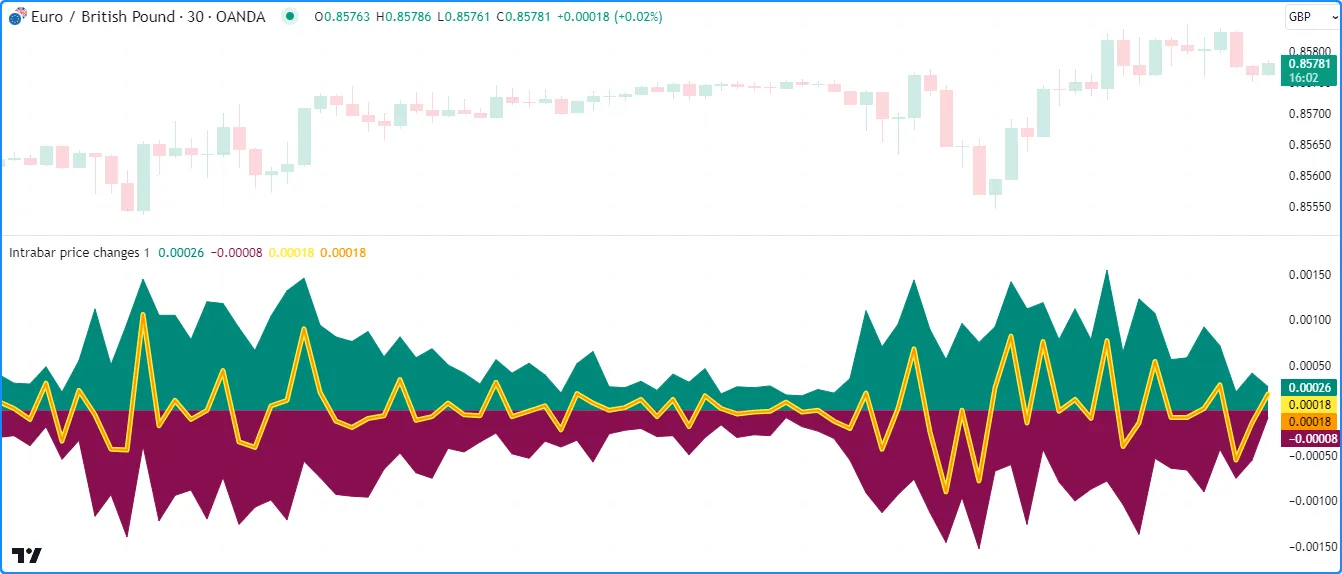
以下脚本使用 intrabar 信息将图表的收盘价变化分解为正值和负值。它调用
request.security_lower_tf()
从每个图表条形图上的 中
获取
ta.change(close)值
的
“浮点”数组,然后使用for…in循环访问数组的所有元素以
累积和求和。该脚本将累积值相加以计算,然后
将结果绘制在图表上,并与进行比较:lowerTimeframepositiveChangenegativeChangenetChangepriceChange
//@version=5
indicator("Intrabar arrays demo", "Intrabar price changes")

//@variable The lower timeframe of the requested data.
string lowerTimeframe = input.timeframe("1", "Timeframe")

//@variable The close-to-close price change.
float priceChange = ta.change(close)

//@variable An array of `close` values from available intrabars on the `lowerTimeframe`.
array<float> intrabarChanges = request.security_lower_tf(syminfo.tickerid, lowerTimeframe, priceChange)

//@variable The total positive intrabar `close` movement on the chart bar.
float positiveChange = 0.0
//@variable The total negative intrabar `close` movement on the chart bar.
float negativeChange = 0.0

// Loop to calculate totals, starting from the chart bar's first available intrabar.
for change in intrabarChanges
    // Add the `change` to `positiveChange` if its sign is 1, and add to `negativeChange` if its sign is -1.
    switch math.sign(change)
        1  => positiveChange += change
        -1 => negativeChange += change

//@variable The sum of `positiveChange` and `negativeChange`. Equals the `priceChange` on bars with available intrabars.
float netChange = positiveChange + negativeChange

// Plot the `positiveChange`, `negativeChange`, and `netChange`.
plot(positiveChange, "Positive intrabar change", color.teal, style = plot.style_area)
plot(negativeChange, "Negative intrabar change", color.maroon, style = plot.style_area)
plot(netChange, "Net intrabar change", color.yellow, 5)
// Plot the `priceChange` to compare.
plot(priceChange, "Chart price change", color.orange, 2)
注意:
- 基于 intrabar 数据的图表可能不会出现在所有可用的图表条上,因为 request.security_lower_tf ()只能访问请求上下文中可用的最近 100,000 个 intrabar。在没有可访问的 intrabar 数据的 图表条上执行此函数时,它将返回一个空数组。
- 每个图表条的 intrabar 数量可能因上下文中可用的数据和脚本执行的图表而异。例如,由于某些 1 分钟间隔内缺乏交易活动,提供商的 1 分钟数据馈送可能不包含 60 分钟时间范围内每分钟的数据。要检查为图表条检索到的 intrabar 数量,可以对 结果 数组使用array.size()。
- 如果该
lowerTimeframe值大于图表的时间范围,脚本将引发运行时错误,因为我们没有ignore_invalid_timeframe在 request.security_lower_tf() 调用中提供参数。
条内数据元组
当传递元组或返回元组的函数调用作为
request.security_lower_tf()expression中的
参数时,结果是一个数组元组,其
类型模板与参数中的类型相对应。例如,使用元组作为将导致函数返回数据。使用元组允许脚本
通过单个
request.security_lower_tf()
函数调用获取多个内部数据数组。[float, string, color]expression[array<float>, array<string>, array<color>]expression
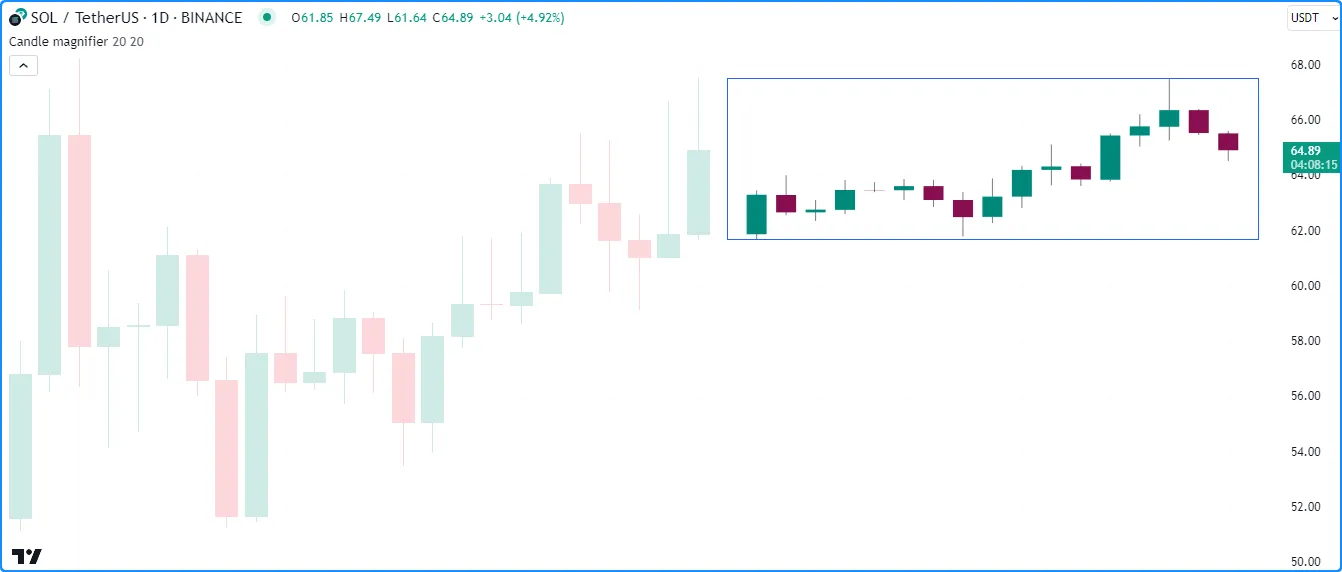
以下示例请求较低时间范围内的 OHLC 数据,并使用线条和框在图表上可视化当前条形图的内部条形图
。脚本调用
request.security_lower_tf()
并以[open, high, low, close]元组作为其expression来检索
表示来自计算的 OHLC 信息的数组lowerTimeframe元组。然后,它使用
for循环设置线条坐标,并使用检索到的数据和当前条形图索引来显示当前图表条形图旁边的结果,从而提供最新蜡烛图内价格变动的“放大视图”。它还
在线条
周围绘制一个框,以指示内部条形图所占据的图表区域:
//@version=5
indicator("Tuples of intrabar data demo", "Candle magnifier", max_lines_count = 500)

//@variable The maximum number of intrabars to display.
int maxIntrabars = input.int(20, "Max intrabars", 1, 250)
//@variable The width of the drawn candle bodies.
int candleWidth = input.int(20, "Candle width", 2)

//@variable The largest valid timeframe closest to `maxIntrabars` times smaller than the chart timeframe.
string lowerTimeframe = timeframe.from_seconds(math.ceil(timeframe.in_seconds() / maxIntrabars))

//@variable An array of lines to represent intrabar wicks.
var array<line> wicks  = array.new<line>()
//@variable An array of lines to represent intrabar bodies.
var array<line> bodies = array.new<line>()
//@variable A box that surrounds the displayed intrabars.
var box magnifierBox = box.new(na, na, na, na, bgcolor = na)

// Fill the `wicks` and `bodies` arrays with blank lines on the first bar.
if barstate.isfirst
    for i = 1 to maxIntrabars
        array.push(wicks, line.new(na, na, na, na, color = color.gray))
        array.push(bodies, line.new(na, na, na, na, width = candleWidth))

//@variable A tuple of "float" arrays containing `open`, `high`, `low`, and `close` prices from the `lowerTimeframe`.
[oData, hData, lData, cData] = request.security_lower_tf(syminfo.tickerid, lowerTimeframe, [open, high, low, close])
//@variable The number of intrabars retrieved from the `lowerTimeframe` on the chart bar.
int numIntrabars = array.size(oData)

if numIntrabars > 0
    // Define the start and end bar index values for intrabar display.
    int startIndex = bar_index + 2
    int endIndex = startIndex + numIntrabars
    // Loop to update lines.
    for i = 0 to maxIntrabars - 1
        line wickLine = array.get(wicks, i)
        line bodyLine = array.get(bodies, i)
        if i < numIntrabars
            //@variable The `bar_index` of the drawing.
            int candleIndex = startIndex + i
            // Update the properties of the `wickLine` and `bodyLine`.
            line.set_xy1(wickLine, startIndex + i, array.get(hData, i))
            line.set_xy2(wickLine, startIndex + i, array.get(lData, i))
            line.set_xy1(bodyLine, startIndex + i, array.get(oData, i))
            line.set_xy2(bodyLine, startIndex + i, array.get(cData, i))
            line.set_color(bodyLine, bodyLine.get_y2() > bodyLine.get_y1() ? color.teal : color.maroon)
            continue
        // Set the coordinates of the `wickLine` and `bodyLine` to `na` if no intrabar data is available at the index.
        line.set_xy1(wickLine, na, na)
        line.set_xy2(wickLine, na, na)
        line.set_xy1(bodyLine, na, na)
        line.set_xy2(bodyLine, na, na)
    // Set the coordinates of the `magnifierBox`.
    box.set_lefttop(magnifierBox, startIndex - 1, array.max(hData))
    box.set_rightbottom(magnifierBox, endIndex, array.min(lData))
注意:
- 该脚本使用两条
线绘制每根蜡烛:一条表示烛芯,另一条表示主体。由于该脚本最多可以在图表上显示 500 条线,因此我们将输入限制
maxIntrabars为 250 条。 - 该值是计算timeframe.in_seconds ()
的
math.ceil()
除以并使用
timeframe.from_seconds()转换为
有效的时间范围字符串
lowerTimeframe的结果 。maxIntrabars - 脚本使用
请求数组的array.max()设置框线的顶部,并使用
请求数组的array.min()
hData设置框线的底部 。正如我们在图表上看到的,这些值对应于 图表条形图的最高点 和 最低点。lData
请求收藏
在某些情况下,脚本可能需要从内部栏上下文中
请求集合的 ID
。但是,与request.security()不同,不能将
集合或调用传递给将它们作为request.security_lower_tf()expression
调用中的参数
返回的函数
,因为数组不能直接引用其他
集合。
尽管存在这些限制,但如果需要,仍然可以 借助包装器类型来请求较低时间范围内的集合 。
为了使 集合可通过 request.security_lower_tf()进行请求,我们必须创建一个 带有字段的UDT 来引用集合 ID。此步骤是必需的,因为 数组不能直接引用其他集合,但可以引用带有集合字段的 UDT:
//@type A "wrapper" type to hold an `array<float>` instance.
type Wrapper
    array<float> collection
定义 UDT后,我们现在可以将UDT
对象Wrapper的 ID 传递
给request.security_lower_tf()中的参数
。expression
一种直接的方法是将内置*.new()函数作为 来调用expression。例如,这行代码在
request.security_lower_tf()Wrapper.new()中
调用
array.from(close)
作为其函数:collection
//@variable An array of `Wrapper` IDs requested from the 1-minute timeframe.
array<Wrapper> wrappers = request.security_lower_tf(syminfo.tickerid, "1", Wrapper.new(array.from(close)))
或者,我们可以创建一个
返回UDT对象的用户定义函数或
方法,并在request.security_lower_tf()中调用该函数
。例如,此代码调用一个返回ID 作为参数的自定义函数:newWrapper()Wrapperexpression
//@function Creates a new `Wrapper` instance to wrap the specified `collection`.
newWrapper(array<float> collection) =>
    Wrapper.new(collection)

//@variable An array of `Wrapper` IDs requested from the 1-minute timeframe.
array<Wrapper> wrappers = request.security_lower_tf(syminfo.tickerid, "1", newWrapper(array.from(close)))
上述任一方法的结果都是一个
数组
,包含Wrapper图表条中所有可用内部条的 ID,脚本可以使用它来引用Wrapper特定内部条的实例并collection在其他操作中使用它们的字段。
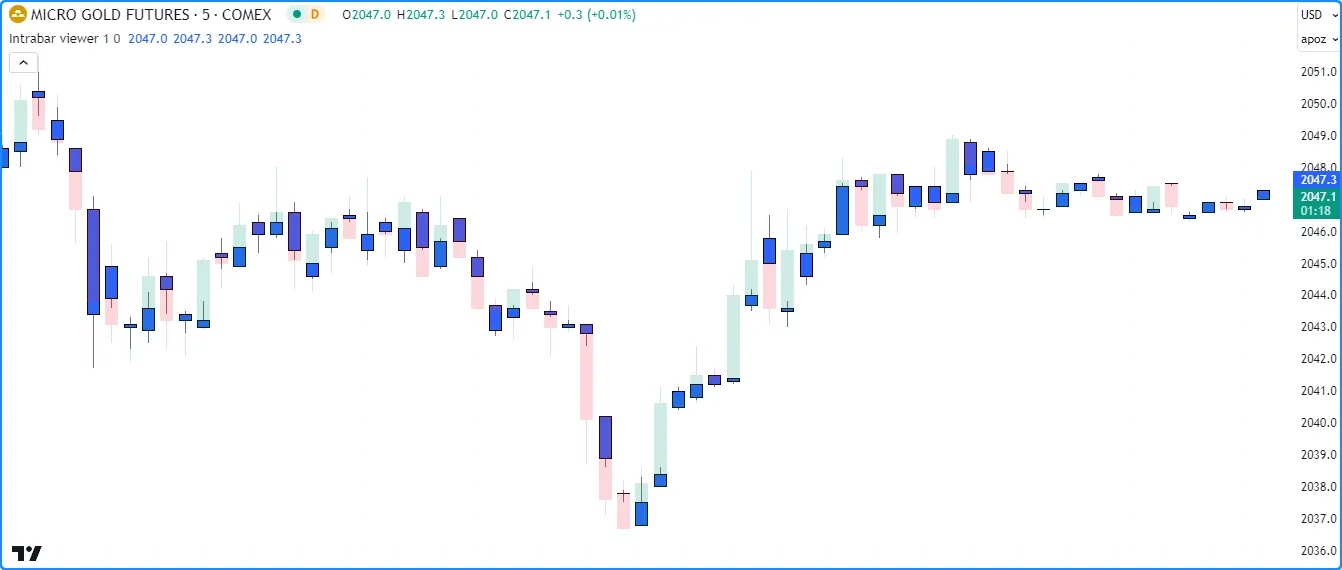
下面的脚本利用这种方法从中收集
内部条形图数据数组lowerTimeframe,并使用它们显示特定内部条形图的数据。其自定义Prices类型包含一个data字段来引用array<float>保存价格数据的实例,用户定义newPrices()函数返回对象的 ID Prices。
该脚本调用
request.security_lower_tf()
并以newPrices()call 作为参数,从图表条形图中的每个 intrabar 中
expression检索
ID数组,然后使用array.get()
从指定的可用 intrabar(如果存在)中获取 ID。最后,它
在分配给该实例的数组
上使用array.get()并调用
plotcandle()
以在图表上显示其值:Pricesdata
//@version=5
indicator("Requesting LTF collections demo", "Intrabar viewer", true)

//@variable The timeframe of the LTF data request.
string lowerTimeframe = input.timeframe("1", "Timeframe")
//@variable The index of the intrabar to show on each chart bar. 0 is the first available intrabar.
int intrabarIndex = input.int(0, "Intrabar to show", 0)

//@variable A custom type to hold an array of price `data`.
type Prices
    array<float> data

//@function Returns a new `Prices` instance containing current `open`, `high`, `low`, and `close` prices.
newPrices() =>
    Prices.new(array.from(open, high, low, close))

//@variable An array of `Prices` requested from the `lowerTimeframe`.
array<Prices> requestedPrices = request.security_lower_tf(syminfo.tickerid, lowerTimeframe, newPrices())

//@variable The `Prices` ID from the `requestedPrices` array at the `intrabarIndex`, or `na` if not available.
Prices intrabarPrices = array.size(requestedPrices) > intrabarIndex ? array.get(requestedPrices, intrabarIndex) : na
//@variable The `data` array from the `intrabarPrices`, or an array of `na` values if `intrabarPrices` is `na`.
array<float> intrabarData = na(intrabarPrices) ? array.new<float>(4, na) : intrabarPrices.data

// Plot the `intrabarData` values as candles.
plotcandle(intrabarData.get(0), intrabarData.get(1), intrabarData.get(2), intrabarData.get(3))
注意:
- 如果
数组
的大小大于
,则变量
intrabarPrices仅引用ID ,因为尝试使用 array.get() 获取不存在的元素将导致越界 错误。PricesrequestedPricesintrabarIndex - 由于脚本不能引用
na值的字段,因此变量仅在存在有效 ID 时
intrabarData引用该data字段 。intrabarPricesPrices - 本例中使用的过程对于实现预期结果来说
并非必需。我们可以避免使用UDT,而是将元组传递
[open, high, low, close]给expression参数以检索数组元组 以进行进一步的操作,如上一节所述 。
自定义上下文
Pine Script™ 包含多个ticker.*()函数,允许脚本构建自定义股票代码 ID,当将其用作request.security()
和
request.security_lower_tf()symbol中的参数
时,这些 ID 可以指定数据请求的附加设置:
- ticker.new()
根据指定的附加
prefix设置构造 自定义股票代码 ID 。tickersessionadjustment - ticker.modify()
tickerid使用附加session和adjustment设置 构造指定的修改形式。 - ticker.heikinashi()、
ticker.renko()、
ticker.pointfigure()、
ticker.kagi()和
ticker.linebreak()
构建了一个
symbol具有 非标准图表设置的修改形式。 - ticker.inherit()
为 构造一个新的股票代码 ID,并使用从函数调用中
symbol指定的 继承的附加参数,允许脚本使用与 相同的修饰符请求数据,包括会话、股息调整、货币转换、非标准图表类型、回溯调整、收盘结算等。from_tickeridsymbolfrom_tickerid - ticker.standard()
构造一个标准的股票代码 ID,表示
symbol不带任何 附加修饰符。
让我们探索一些应用ticker.*()
函数从自定义上下文请求数据的实际例子。
假设我们想在股票代码的价格中包含股息调整,但不启用图表设置中“代码”部分的“调整股息数据”选项。我们可以在脚本中实现此目的,方法是使用
ticker.new()
或
ticker.modify()为该工具构建自定义股票代码 ID
,并将adjustment值设为
adjustment.dividends。
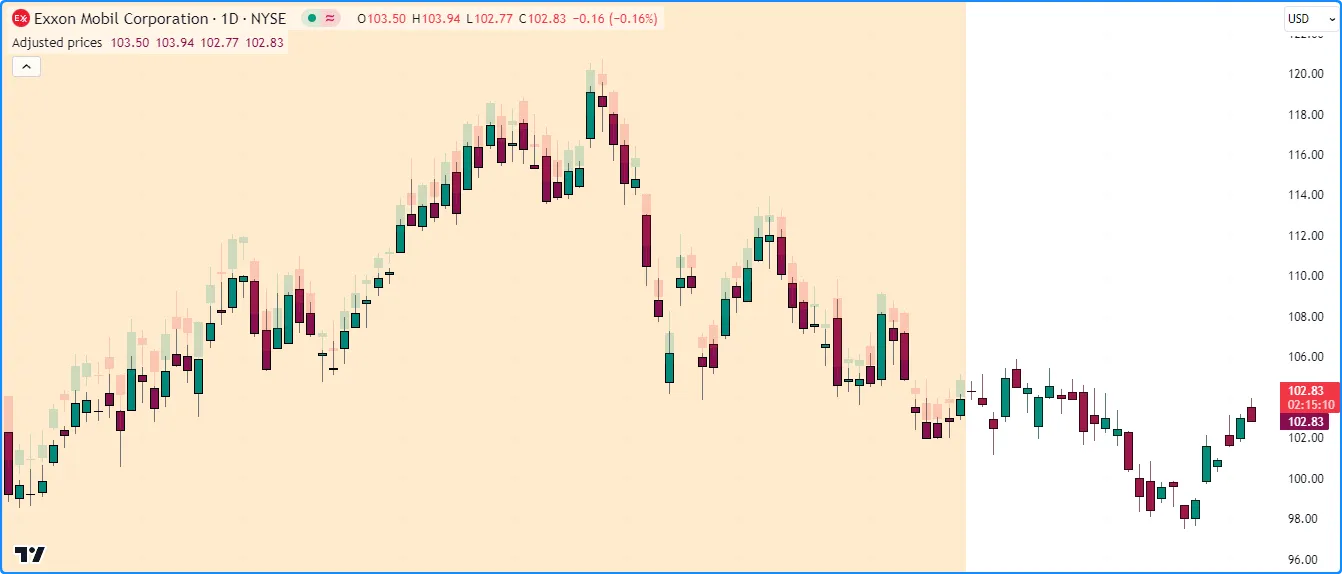
adjustedTickerID此脚本使用
ticker.modify()创建,使用该股票代码 ID 作为symbolrequest.security
()中
的 来检索
调整后价格值的元组,然后将结果绘制为
图表上的蜡烛图
。当请求的价格与未进行股息调整的价格不同时,它还会突出显示背景。
正如我们在下面的“NYSE:XOM”图表中看到的,启用股息调整会导致最新股息日期之前的历史值不同:
//@version=5
indicator("Custom contexts demo 1", "Adjusted prices", true)

//@variable A custom ticker ID representing the chart's symbol with the dividend adjustment modifier.
string adjustedTickerID = ticker.modify(syminfo.tickerid, adjustment = adjustment.dividends)

// Request the adjusted prices for the chart's symbol.
[o, h, l, c] = request.security(adjustedTickerID, timeframe.period, [open, high, low, close])

//@variable The color of the candles on the chart.
color candleColor = c > o ? color.teal : color.maroon

// Plot the adjusted prices.
plotcandle(o, h, l, c, "Adjusted Prices", candleColor)
// Highlight the background when `c` is different from `close`.
bgcolor(c != close ? color.new(color.orange, 80) : na)
注意:
- 如果构造的股票代码 ID 中包含的修饰符不适用于该符号,则脚本将在请求数据时忽略该修饰符。例如,此脚本将在外汇符号(如“EURUSD”)上显示与主图表相同的值。
虽然上面的示例演示了一种修改图表符号的简单方法,但ticker.*()函数更常见的用例是在请求数据时将自定义修饰符应用于另一个符号。如果脚本中引用的股票代码 ID 已经具有想要应用的修饰符(例如,调整设置、会话类型等),则他们可以使用
ticker.inherit()
快速高效地将这些修饰符添加到另一个符号。
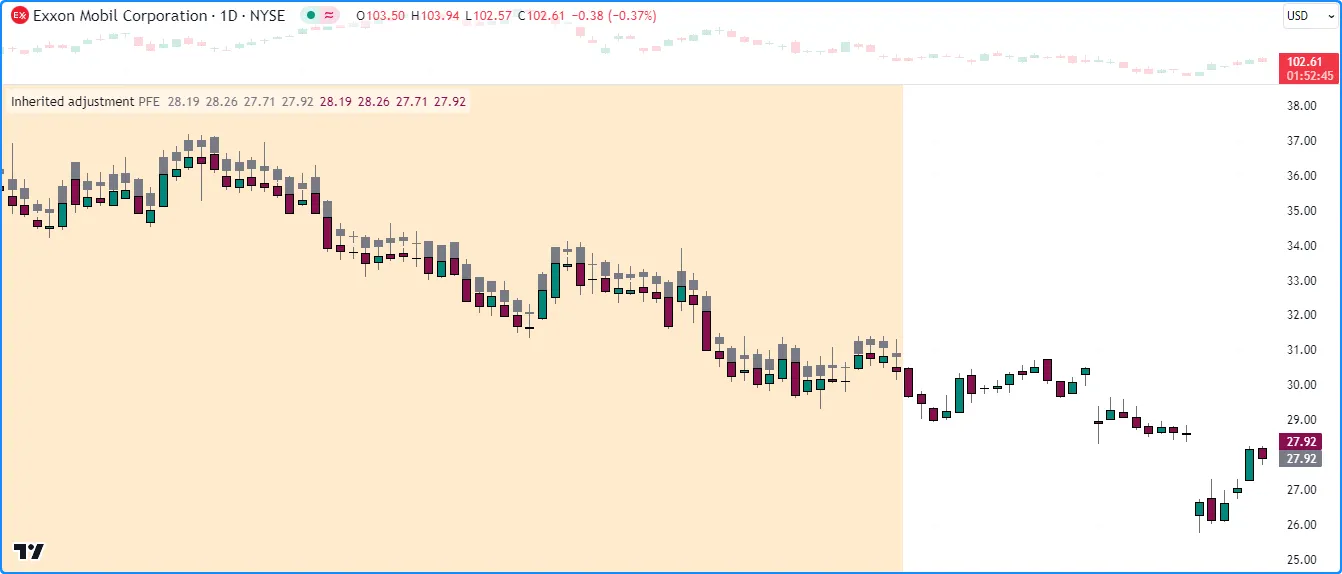
在下面的示例中,我们编辑了上一个脚本,使用symbolInput从 继承的修饰符
请求 的数据adjustedTickerID。此脚本调用
ticker.inherit()
来构造并在request.security()inheritedTickerID调用中使用该股票代码 ID
。它还请求 的数据而不使用其他修饰符,并在单独的图表窗格中绘制
两个股票代码 ID 的蜡烛图
以比较差异。symbolInput
如图所示,使用 请求的数据inheritedTickerID
包括股息调整,而直接使用 请求的数据
symbolInput则不包含:
//@version=5
indicator("Custom contexts demo 2", "Inherited adjustment")

//@variable The symbol to request data from.
string symbolInput = input.symbol("NYSE:PFE", "Symbol")

//@variable A custom ticker ID representing the chart's symbol with the dividend adjustment modifier.
string adjustedTickerID = ticker.modify(syminfo.tickerid, adjustment = adjustment.dividends)
//@variable A custom ticker ID representing the `symbolInput` with modifiers inherited from the `adjustedTickerID`.
string inheritedTickerID = ticker.inherit(adjustedTickerID, symbolInput)

// Request prices using the `symbolInput`.
[o1, h1, l1, c1] = request.security(symbolInput, timeframe.period, [open, high, low, close])
// Request prices using the `inheritedTickerID`.
[o2, h2, l2, c2] = request.security(inheritedTickerID, timeframe.period, [open, high, low, close])

//@variable The color of the candles that use the `inheritedTickerID` prices.
color candleColor = c2 > o2 ? color.teal : color.maroon

// Plot the `symbol` prices.
plotcandle(o1, h1, l1, c1, "Symbol", color.gray, color.gray, bordercolor = color.gray)
// Plot the `inheritedTickerID` prices.
plotcandle(o2, h2, l2, c2, "Symbol With Modifiers", candleColor)
// Highlight the background when `c1` is different from `c2`.
bgcolor(c1 != c2 ? color.new(color.orange, 80) : na)
注意:
- 由于代表syminfo.tickerid
adjustedTickerID的修改形式 ,如果我们以其他方式修改图表的上下文,例如更改图表类型或在图表的设置中启用延长交易时间,这些修饰符也将适用于 和 。但是,它们 不适用于 ,因为它代表 标准的股票代码 ID。adjustedTickerIDinheritedTickerIDsymbolInput
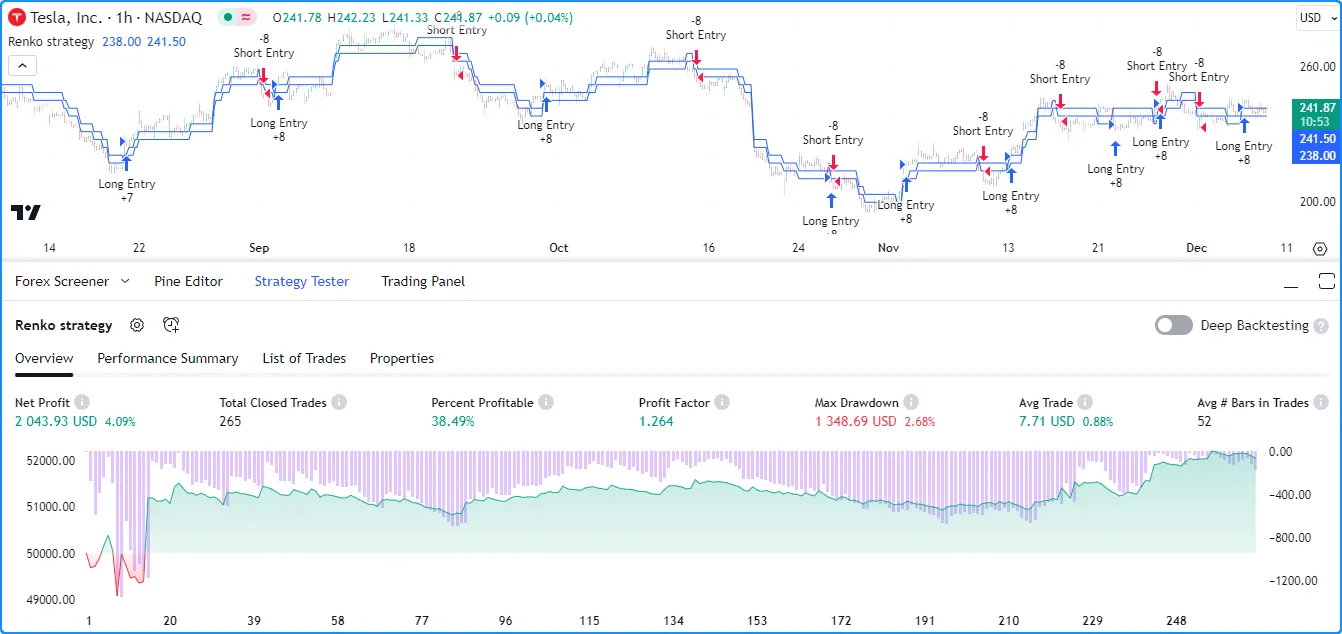
请求自定义上下文的另一个常见用例是检索使用 非标准图表计算的数据。例如,假设我们想使用 Renko 价格值来计算 strategies() 脚本中的交易信号。如果我们只是将图表类型更改为“Renko”来获取价格,该策略 也会根据这些合成价格模拟其交易,从而产生 误导性结果:

//@version=5
strategy(
     "Custom contexts demo 3", "Renko strategy", true, default_qty_type = strategy.percent_of_equity,
     default_qty_value = 2, initial_capital = 50000, slippage = 2,
     commission_type = strategy.commission.cash_per_contract, commission_value = 1, margin_long = 100,
     margin_short = 100
 )

//@variable When `true`, the strategy places a long market order.
bool longEntry = ta.crossover(close, open)
//@variable When `true`, the strategy places a short market order.
bool shortEntry = ta.crossunder(close, open)

if longEntry
    strategy.entry("Long Entry", strategy.long)
if shortEntry
    strategy.entry("Short Entry", strategy.short)
为了确保我们的策略根据实际价格显示结果,我们可以使用ticker.renko()创建 Renko 代码 ID, 同时将图表保持在标准类型,从而允许脚本请求和使用 Renko 价格来计算其信号,而无需计算策略结果:
//@version=5
strategy(
     "Custom contexts demo 3", "Renko strategy", true, default_qty_type = strategy.percent_of_equity,
     default_qty_value = 2, initial_capital = 50000, slippage = 1,
     commission_type = strategy.commission.cash_per_contract, commission_value = 1, margin_long = 100,
     margin_short = 100
 )

//@variable A Renko ticker ID.
string renkoTickerID = ticker.renko(syminfo.tickerid, "ATR", 14)
// Request the `open` and `close` prices using the `renkoTickerID`.
[renkoOpen, renkoClose] = request.security(renkoTickerID, timeframe.period, [open, close])

//@variable When `true`, the strategy places a long market order.
bool longEntry = ta.crossover(renkoClose, renkoOpen)
//@variable When `true`, the strategy places a short market order.
bool shortEntry = ta.crossunder(renkoClose, renkoOpen)

if longEntry
    strategy.entry("Long Entry", strategy.long)
if shortEntry
    strategy.entry("Short Entry", strategy.short)

plot(renkoOpen)
plot(renkoClose)
历史和实时行为
命名空间中的函数在历史和实时条上的行为可能有所不同。此行为与 Pine 的执行模型request.*()密切相关。
考虑一下脚本在主上下文中的行为方式。在图表的整个历史中,脚本会计算一次所需的值并将 它们提交到该条形图,以便稍后执行时可以访问它们的状态。但是,在未确认的条形图上,脚本会在每次更新条形图数据时重新计算其值以与实时变化保持一致。在重新计算该条形图上的值之前,它会将计算的值恢复到其最后提交的状态,也称为 回滚,并且只有在条形图关闭后才会将值提交到该条形图。
现在考虑使用request.security()从其他上下文请求数据的行为 。与在主上下文中评估历史条形图时一样, request.security() 仅在其指定上下文中确认条形图时才返回新的历史值。在实时条形图上执行时,它会在每个图表条形图上返回重新计算的值,类似于脚本在打开的图表条形图上重新计算主上下文中的值的方式。
但是,该函数仅在其上下文中的条形图关闭时确认请求的值。当脚本重新开始执行时,之前被视为实时条形图的内容将成为历史条形图。因此, request.security() 将仅返回它在这些条形图上确认的值。本质上,这种行为意味着请求的数据可能会在其值在实时条形图上波动而没有上下文确认时重新绘制。
在大多数情况下,当脚本从更广泛的上下文中请求数据时,通常需要确认的、稳定的值,这些值不会在实时条形图上波动。 以下部分解释了如何实现这样的结果并避免重新绘制数据请求。
避免重新粉刷
更高时间范围的数据
当请求更高时间范围的值时,它们可能会被重新绘制,因为实时条形图可能包含来自正在开发的 HTF 条形图的未确认信息,并且脚本可能会调整新值出现在历史条形图上的时间。为了避免重新绘制 HTF 数据,必须确保该函数仅返回所有条形图上具有一致时间的确认值,而不管条形图状态如何。
实现非重新绘制结果的最可靠方法是使用expression仅引用过去条形图的参数(例如
close[1]),同时使用
barmerge.lookahead_on
作为lookahead值。
不建议将barmerge.lookahead_on
与非偏移 HTF 数据请求
结合使用
,因为它会提示request.security()
“向前看” HTF 条的最终值,在脚本历史记录中实际可用之前expression检索已确认的值。但是,如果 中使用的值至少偏移了一个条,则函数检索的“未来”数据不再来自未来。相反,数据表示来自已建立的可用HTF 条的确认值。换句话说,对 施加偏移可expression有效防止脚本重新启动执行时请求的数据重新绘制,并消除历史系列中的前瞻偏差。
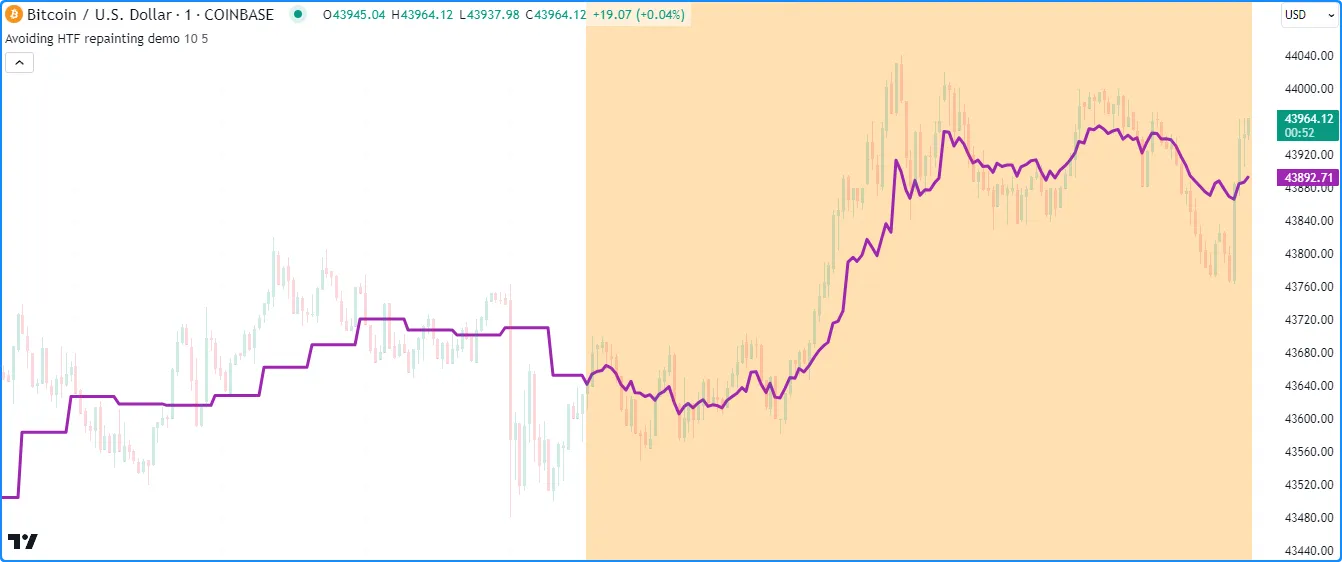
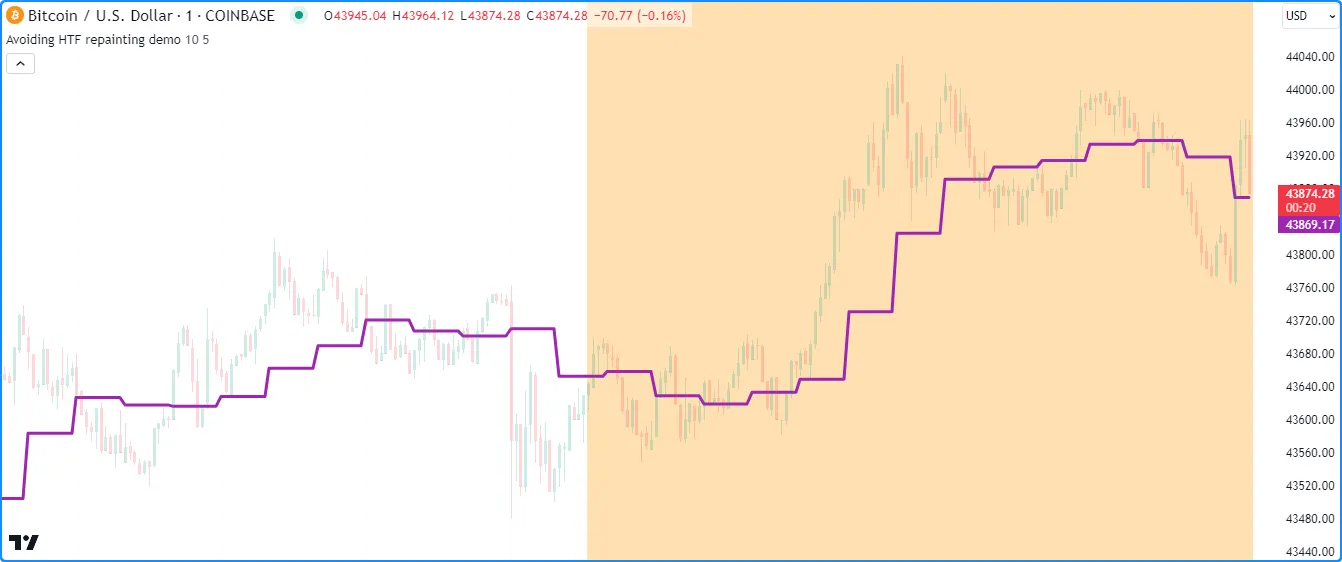
以下示例演示了重绘 HTF 数据请求。该脚本使用 request.security()而不使用偏移修改或其他参数来检索来自更高时间范围的ta.wma()调用 的结果 。它还突出显示背景以指示在计算过程中哪些条处于实时状态。
如下图所示, 请求的 WMA 的绘图 仅在 HTF 条关闭时在历史条上发生变化,而它在所有实时条上波动,因为数据包含来自较高时间范围的未确认值:
//@version=5
indicator("Avoiding HTF repainting demo", overlay = true)

//@variable The multiplier applied to the chart's timeframe.
int tfMultiplier = input.int(10, "Timeframe multiplier", 1)
//@variable The number of bars in the moving average.
int length = input.int(5, "WMA smoothing length")

//@variable The valid timeframe string closest to `tfMultiplier` times larger than the chart timeframe.
string timeframe = timeframe.from_seconds(timeframe.in_seconds() * tfMultiplier)

//@variable The weighted MA of `close` prices over `length` bars on the `timeframe`.
//          This request repaints because it includes unconfirmed HTF data on realtime bars and it may offset the
//          times of its historical results.
float requestedWMA = request.security(syminfo.tickerid, timeframe, ta.wma(close, length))

// Plot the requested series.
plot(requestedWMA, "HTF WMA", color.purple, 3)
// Highlight the background on realtime bars.
bgcolor(barstate.isrealtime ? color.new(color.orange, 70) : na, title = "Realtime bar highlight")
为了避免在此脚本中重新绘制,我们可以将
request.security()
调用
添加lookahead = barmerge.lookahead_on到
ta.wma()调用历史记录
中,并使用历史引用运算符
[]将 ta.wma() 的调用历史记录偏移一个条形图,确保请求始终在每个新请求开始时检索最后确认的 HTF 条形图的 WMA 。与之前的脚本不同,此版本在历史和实时条形图状态上具有一致的行为,如下所示:timeframe
//@version=5
indicator("Avoiding HTF repainting demo", overlay = true)

//@variable The multiplier applied to the chart's timeframe.
int tfMultiplier = input.int(10, "Timeframe multiplier", 1)
//@variable The number of bars in the moving average.
int length = input.int(5, "WMA smoothing length")

//@variable The valid timeframe string closest to `tfMultiplier` times larger than the chart timeframe.
string timeframe = timeframe.from_seconds(timeframe.in_seconds() * tfMultiplier)

//@variable The weighted MA of `close` prices over `length` bars on the `timeframe`.
//          This request does not repaint, as it always references the last confirmed WMA value on all bars.
float requestedWMA = request.security(
     syminfo.tickerid, timeframe, ta.wma(close, length)[1], lookahead = barmerge.lookahead_on
 )

// Plot the requested value.
plot(requestedWMA, "HTF WMA", color.purple, 3)
// Highlight the background on realtime bars.
bgcolor(barstate.isrealtime ? color.new(color.orange, 70) : na, title = "Realtime bar highlight")
较低时间范围的数据
request.security () 和 request.security_lower_tf() 函数可从较低时间框架上下文中检索数据。 request.security() 函数只能从每个图表条中的单个内部条中检索数据,而 request.security_lower_tf()可从所有可用的内部条 中检索数据。
当使用这些函数检索条形图内数据时,请务必注意,此类请求无法避免重绘行为。历史和实时序列通常依赖于单独的数据馈送。数据提供商可能会追溯修改实时数据,并且实时数据馈送中可能会发生竞争,如本页的数据馈送部分所述 。任何一种情况都可能导致在脚本重新启动执行后,在实时条形图上检索到的条形图内数据重绘。
此外,一种会导致重新绘制 LTF 请求的特殊情况是使用 request.security() 和 barmerge.lookahead_on 从每个图表条中的第一个内部条中检索数据。虽然它通常会在历史条上按预期工作,但它只会跟踪实时条上最新的内部条,因为 request.security() 不会保留所有内部条信息,并且该函数在实时条上检索的内部条在重新启动脚本执行之前是未排序的:
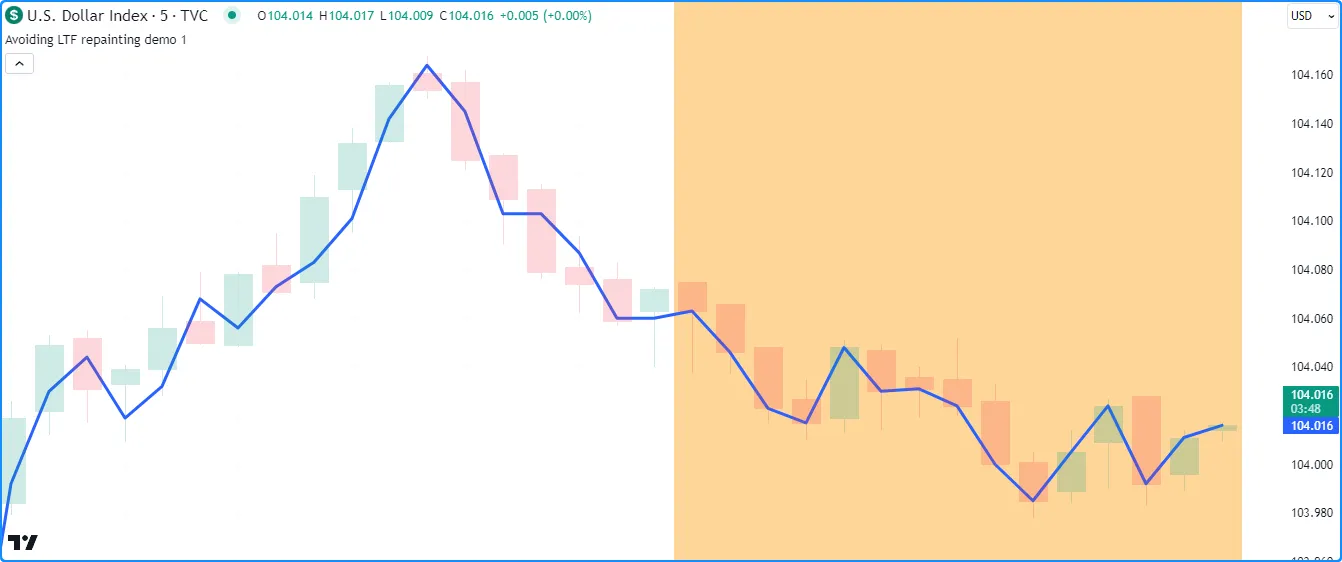
//@version=5
indicator("Avoiding LTF repainting demo", overlay = true)

//@variable The lower timeframe of the requested data.
string lowerTimeframe = input.timeframe("1", "Timeframe")

//@variable The first intrabar `close` requested from the `lowerTimeframe` on each bar.
//          Only works as intended on historical bars.
float requestedClose = request.security(syminfo.tickerid, lowerTimeframe, close, lookahead = barmerge.lookahead_on)

// Plot the `requestedClose`.
plot(requestedClose, "First intrabar close", linewidth = 3)
// Highlight the background on realtime bars.
bgcolor(barstate.isrealtime ? color.new(color.orange, 60) : na, title = "Realtime bar Highlight")
可以缓解此行为并通过使用request.security_lower_tf()来跟踪第一个 intrabar 或图表条中任何可用 intrabar 的值, 因为它维护一个 按它们进入时间排序的 intrabar 值 数组。在这里,我们在请求的 intrabar 数据数组 上 调用array.first()来 从每个图表条中第一个可用的 intrabar 检索 收盘价:
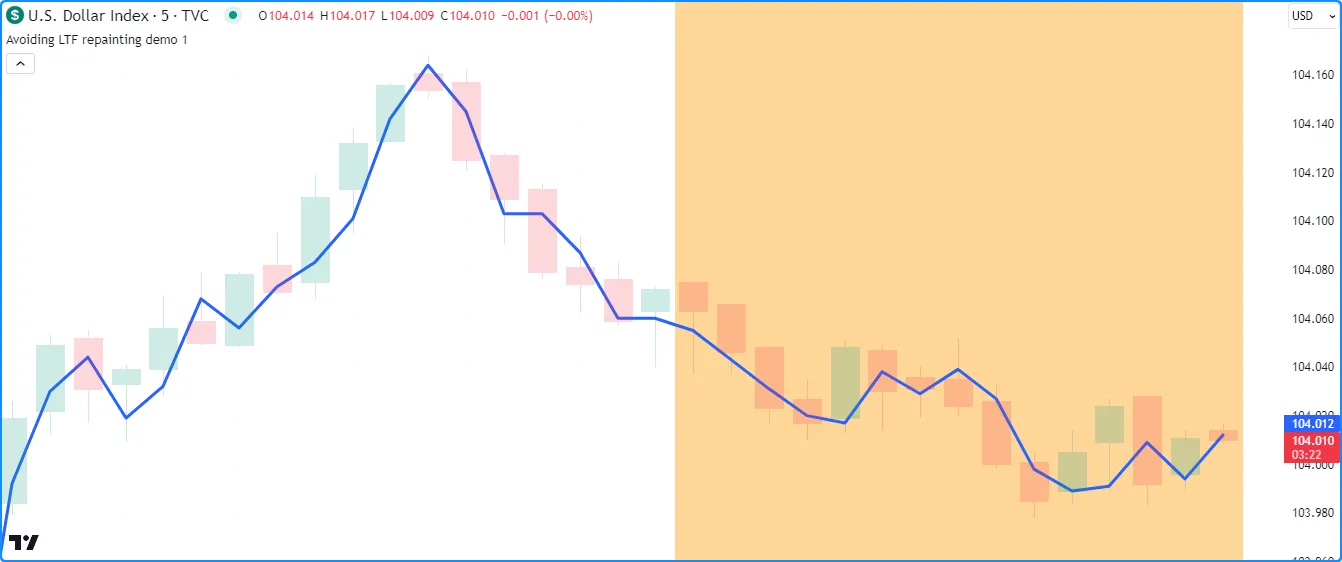
//@version=5
indicator("Avoiding LTF repainting demo", overlay = true)

//@variable The lower timeframe of the requested data.
string lowerTimeframe = input.timeframe("1", "Timeframe")

//@variable An array of intrabar `close` values requested from the `lowerTimeframe` on each bar.
array<float> requestedCloses = request.security_lower_tf(syminfo.tickerid, lowerTimeframe, close)

//@variable The first intrabar `close` on each bar with available data.
float firstClose = requestedCloses.size() > 0 ? requestedCloses.first() : na

// Plot the `firstClose`.
plot(firstClose, "First intrabar close", linewidth = 3)
// Highlight the background on realtime bars.
bgcolor(barstate.isrealtime ? color.new(color.orange, 60) : na, title = "Realtime bar Highlight")
注意:
- 虽然 request.security_lower_tf() 针对处理历史和实时内部条形图进行了优化,但在某些情况下,由于与提供商的数据差异,仍有可能出现轻微的重绘,如上所述。
- 此代码可能不会显示所有可用图表条上的内部条数据,具体取决于每个图表条包含多少个内部条,因为
request.*()函数可以从 LTF 上下文中检索最多 100,000 个内部条。有关更多信息,请参阅 限制页面的此部分 。
`请求.currency_rate()`
当脚本需要将一种货币表示的值转换为另一种货币表示的值时,可以使用 request.currency_rate()。此函数根据“FX_IDC”数据请求每日汇率以进行货币转换计算, 为使用 request.security()获取特定货币对或 价差提供了一种更简单的替代方法。
虽然可以使用 request.security()来检索每日货币汇率,但它的用例比request.currency_rate() 更复杂 ,因为需要为货币对或价差提供有效的代码 ID才能请求汇率。此外,历史偏移量和 barmerge.lookahead_on也是防止结果重绘所必需的,如本节 所述 。
另一方面,request.currency_rate() 函数只需要货币 代码。使用此函数请求汇率时不需要股票代码 ID,并且可以确保无需额外指定即可获得非重绘结果。
该函数的签名如下:
request.currency_rate(from, to, ignore_invalid_currency) → series float参数from指定要转换的货币,参数to
指定目标货币。两个参数均接受ISO 4217格式的“字符串”值(例如“USD”)或任何内置currency.*变量(例如
currency.USD)。
当函数无法计算出调用中提供的
from和货币之间的有效兑换率时
,可以决定是否引发运行时错误或通过参数返回na。默认值为,表示函数将引发运行时错误并停止脚本的执行。toignore_invalid_currencyfalse
以下示例演示了 request.currency_rate()的一个简单用例。假设我们想使用每日汇率 将以土耳其里拉 ( currency.TRY ) 表示的值转换为韩元 ( currency.KRW )。如果我们使用request.security()来检索汇率,我们必须提供有效的股票代码 ID 并请求 前一天 最后确认的 收盘价。
在这种情况下,不存在允许我们直接使用
request.security()检索转换率的“FX_IDC”符号。因此,我们首先需要一个
价差的股票代码 ID
,该价差将 TRY 转换为中间货币(例如 USD),然后将中间货币转换为 KRW。然后,我们可以在 request.security() 中使用该股票代码 ID
作为 barmerge.lookahead_on作为
值来
请求close[1]非重绘每日汇率。expressionlookahead
或者,我们可以通过调用request.currency_rate()更简单地实现相同的结果
。此函数为我们完成了所有繁重的工作,只需要from
货币to参数即可执行计算。
如下所示,两种方法返回的每日利率相同:
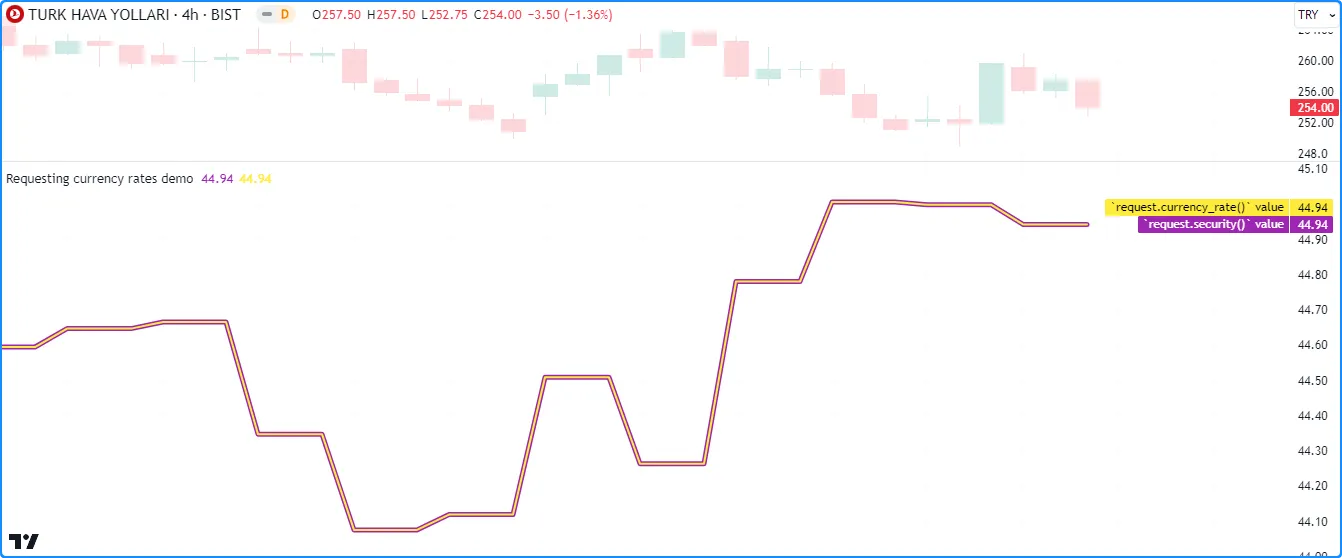
//@version=5
indicator("Requesting currency rates demo")

//@variable The currency to convert.
simple string fromCurrency = currency.TRY
//@variable The resulting currency.
simple string toCurrency = currency.KRW

//@variable The spread symbol to request. Required in `request.security()` since no direct "FX_IDC" rate exists.
simple string spreadSymbol = str.format("FX_IDC:{0}{2} * FX_IDC:{2}{1}", fromCurrency, toCurrency, currency.USD)

//@variable The non-repainting conversion rate from `request.security()` using the `spreadSymbol`.
float securityRequestedRate = request.security(spreadSymbol, "1D", close[1], lookahead = barmerge.lookahead_on)
//@variable The non-repainting conversion rate from `request.currency_rate()`.
float nonSecurityRequestedRate = request.currency_rate(fromCurrency, toCurrency)

// Plot the requested rates. We can multiply TRY values by these rates to convert them to KRW.
plot(securityRequestedRate, "`request.security()` value", color.purple, 5)
plot(nonSecurityRequestedRate, "`request.currency_rate()` value", color.yellow, 2)
`request.dividends()`、`request.splits()` 和`request.earnings()`
分析股票的收益数据和公司行为有助于了解其潜在的财务实力。Pine Script™ 能够通过 request.dividends()、 request.splits()和 request.earnings()检索有关适用股票的基本信息。
这些是函数的签名:
request.dividends(ticker, field, gaps, lookahead, ignore_invalid_symbol, currency) → series float
request.splits(ticker, field, gaps, lookahead, ignore_invalid_symbol) → series float
request.earnings(ticker, field, gaps, lookahead, ignore_invalid_symbol, currency) → series float每个函数在其签名中都有相同的参数,但request.splits()除外
,它没有currency参数。
请注意,与symbol其他request.*()
函数中的参数不同,ticker这些函数中的参数仅接受
“交易所:符号”对,例如“NASDAQ:AAPL”。内置的
syminfo.ticker
变量不适用于这些函数,因为它不包含交易所信息。在这种情况下,必须使用
syminfo.tickerid
。
参数field决定函数将检索的数据。每个函数都接受不同的内置变量作为参数,
field因为每个函数请求的股票信息不同:
- request.dividends
()
函数检索股票的当前股息信息,即发行公司向除息日之前购买股票的投资者支付的每股金额。将内置的
profits.gross
或
profits.net
变量传递给
field参数可指定返回值是代表公司从其支出中扣除费用之前的股息还是之后的股息。 - request.splits()函数
检索股票的当前拆分和反向拆分信息。当公司增加其流通股数以促进流动性时,就会发生拆分。当公司合并其股票并以更高的价格提供,以吸引特定投资者或维持其在具有最低每股价格的市场上的上市时,就会发生反向拆分。公司将其拆分信息表示为比率。例如,5:1 拆分意味着公司向其股东发行了额外的股份,以便他们拥有拆分前的五倍股份,并且每股的原始价格变为之前价格的五分之一。将
splits.numerator
或
splits.denominator传递
给request.splits()
field的参数 决定它是否返回拆分比率的分子或分母。 - request.earnings
()
函数检索股票发行公司的每股收益 (EPS) 信息
ticker。EPS 值是公司净收入与流通股数的比率,投资者将其视为公司盈利能力的指标。将 profits.actual、 profits.estimate或 profits.standardized 作为request.earnings()field中的参数 分别传递可确定函数请求的是实际 EPS 值、估计 EPS 值还是标准化 EPS 值。
gaps有关这些函数的、lookahead和
ignore_invalid_symbol参数的
详细说明,请参阅本页顶部的共同特征部分。
值得注意的是,这些函数返回的值反映了可用的数据。此行为不同于来自 request.financial() 调用的财务数据,因为此类调用的基础数据根据公司的财务报告期而可用。
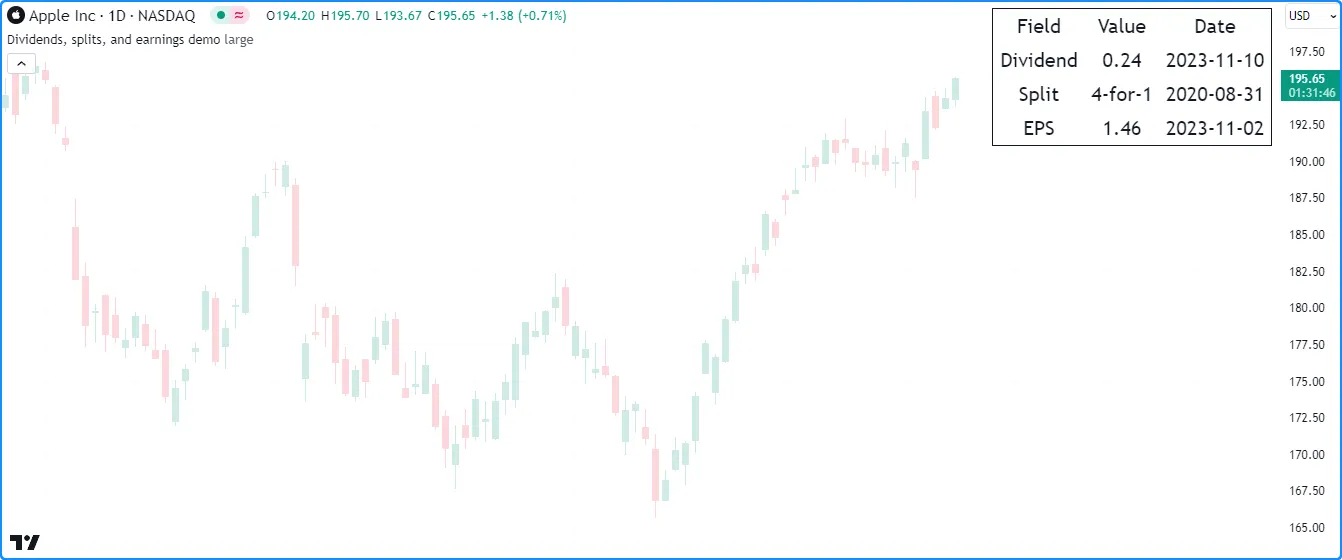
这里我们提供了一个示例,该示例显示了一个方便的
表格
,其中包含最新的股息、拆分和 EPS 数据。该脚本调用request.*()本节中讨论的函数来检索数据,然后使用函数将值转换为“字符串” ,并使用
table.cell()str.*()
显示结果:infoTable
//@version=5
indicator("Dividends, splits, and earnings demo", overlay = true)

//@variable The size of the table's text.
string tableSize = input.string(
     size.large, "Table size", [size.auto, size.tiny, size.small, size.normal, size.large, size.huge]
 )

//@variable The color of the table's text and frame.
var color tableColor = chart.fg_color
//@variable A `table` displaying the latest dividend, split, and EPS information.
var table infoTable = table.new(position.top_right, 3, 4, frame_color = tableColor, frame_width = 1)

// Add header cells on the first bar.
if barstate.isfirst
    table.cell(infoTable, 0, 0, "Field", text_color = tableColor, text_size = tableSize)
    table.cell(infoTable, 1, 0, "Value", text_color = tableColor, text_size = tableSize)
    table.cell(infoTable, 2, 0, "Date", text_color = tableColor, text_size = tableSize)
    table.cell(infoTable, 0, 1, "Dividend", text_color = tableColor, text_size = tableSize)
    table.cell(infoTable, 0, 2, "Split", text_color = tableColor, text_size = tableSize)
    table.cell(infoTable, 0, 3, "EPS", text_color = tableColor, text_size = tableSize)

//@variable The amount of the last reported dividend as of the current bar.
float latestDividend = request.dividends(syminfo.tickerid, dividends.gross, barmerge.gaps_on)
//@variable The numerator of that last reported split ratio as of the current bar.
float latestSplitNum = request.splits(syminfo.tickerid, splits.numerator, barmerge.gaps_on)
//@variable The denominator of the last reported split ratio as of the current bar.
float latestSplitDen = request.splits(syminfo.tickerid, splits.denominator, barmerge.gaps_on)
//@variable The last reported earnings per share as of the current bar.
float latestEPS = request.earnings(syminfo.tickerid, earnings.actual, barmerge.gaps_on)

// Update the "Value" and "Date" columns when new values come in.
if not na(latestDividend)
    table.cell(
         infoTable, 1, 1, str.tostring(math.round(latestDividend, 3)), text_color = tableColor, text_size = tableSize
     )
    table.cell(infoTable, 2, 1, str.format_time(time, "yyyy-MM-dd"), text_color = tableColor, text_size = tableSize)
if not na(latestSplitNum)
    table.cell(
         infoTable, 1, 2, str.format("{0}-for-{1}", latestSplitNum, latestSplitDen), text_color = tableColor,
         text_size = tableSize
     )
    table.cell(infoTable, 2, 2, str.format_time(time, "yyyy-MM-dd"), text_color = tableColor, text_size = tableSize)
if not na(latestEPS)
    table.cell(infoTable, 1, 3, str.tostring(latestEPS), text_color = tableColor, text_size = tableSize)
    table.cell(infoTable, 2, 3, str.format_time(time, "yyyy-MM-dd"), text_color = tableColor, text_size = tableSize)
注意:
-
我们在调用中包含了
barmerge.gaps_on
request.*(),因此它们仅在有新数据可用时才返回值。否则,它们返回 na。 - 脚本会为第一个图表条上的变量分配一个
表格
ID
infoTable。在后续条上,只要有数据可用,它就会用新信息更新必要的单元格。 request.*()如果图表历史记录中的任何调用均未提供任何信息(例如,如果ticker没有股息信息),则脚本不会初始化相应的单元格,因为这是不必要的。
`request.quandl()`
TradingView 与多家金融科技公司建立了合作伙伴关系,为用户提供关于金融工具、经济数据等的大量信息。我们的众多合作伙伴之一是Nasdaq Data Link(前身为 Quandl),它提供了多个外部数据源,脚本可以通过 request.quandl() 函数访问这些数据源。
这是该函数的签名:
request.quandl(ticker, gaps, index, ignore_invalid_symbol) → series float该ticker参数接受一个“简单字符串”,表示纳斯达克数据链接上发布的数据库的 ID 及其时间序列代码,以“/”分隔符分隔。例如,代码“FRED/DFF”表示来自“美联储经济数据”数据库的“有效联邦基金利率”时间序列。
该index参数接受一个“简单 int”,表示请求数据的列索引,其中 0 是第一个可用列。请参阅 Nasdaq Data Link 网站上的数据库文档以查看可用列。
有关gaps和ignore_invalid_symbol参数的详细信息,请参阅
本页的共同特征部分。
该脚本从“比特币数据洞察”(“BCHAIN”)数据库请求比特币哈希率(“HRATE”)信息,并 在图表上 绘制检索到的时间序列数据。它使用color.from_gradient()根据从当前哈希率到其历史最高点 的距离为面积图 着色 :
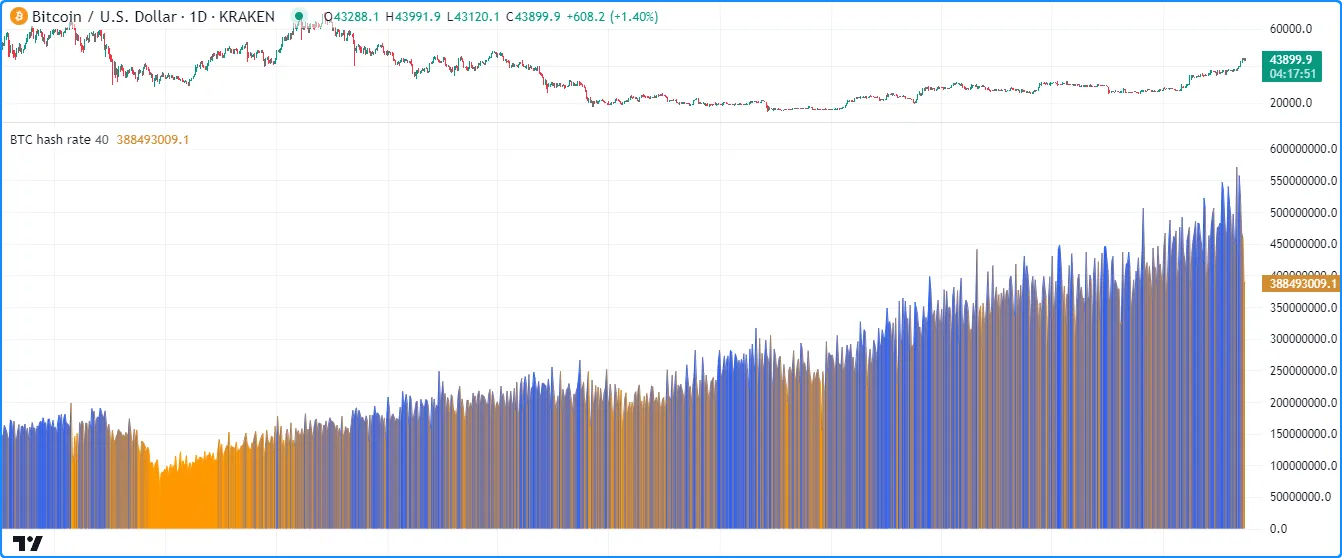
//@version=5
indicator("Quandl demo", "BTC hash rate")

//@variable The estimated hash rate for the Bitcoin network.
float hashRate = request.quandl("BCHAIN/HRATE", barmerge.gaps_off, 0)
//@variable The percentage threshold from the all-time highest `hashRate`.
float dropThreshold = input.int(40, "Drop threshold", 0, 100)

//@variable The all-time highest `hashRate`.
float maxHashRate = ta.max(hashRate)
//@variable The value `dropThreshold` percent below the `maxHashRate`.
float minHashRate = maxHashRate * (100 - dropThreshold) / 100
//@variable The color of the plot based on the `minHashRate` and `maxHashRate`.
color plotColor = color.from_gradient(hashRate, minHashRate, maxHashRate, color.orange, color.blue)

// Plot the `hashRate`.
plot(hashRate, "Hash Rate Estimate", plotColor, style = plot.style_area)
`request.financial()`
财务指标为投资者提供了有关公司经济和财务状况的见解,而这些见解仅通过分析其股价是无法获得的。TradingView 提供了来自FactSet的各种财务指标,交易者可以通过图表“指标”菜单中的“财务”选项卡访问这些指标。脚本可以通过request.financial()函数直接访问工具的可用指标 。
这是该函数的签名:
request.financial(symbol, financial_id, period, gaps, ignore_invalid_symbol, currency) → series float与request.dividends()、
request.splits()和
request.earnings()中的第一个参数一样
,request.financial()symbol中的参数
需要“Exchange:Symbol”对。要请求图表股票代码 ID 的财务信息,请使用
syminfo.tickerid,因为
syminfo.ticker
不起作用。
该financial_id参数接受一个“简单字符串”,表示所请求财务指标的 ID。TradingView 有许多财务指标可供选择。请参阅
下面的财务 ID部分,了解所有可访问指标及其“字符串”标识符的概述。
该period参数指定新请求数据的会计期间。它接受以下参数之一:
“FQ”(季度)、“FH”(半年)、“FY”(年度)或“TTM”(过去十二个月) 。并非所有指标或工具都提供所有会计期间。要确认哪些期间适用于特定指标,请参阅财务 ID部分中表格的第二列
。
有关该函数的、和参数的详细说明,
请参阅本页的
常见特性部分。gapsignore_invalid_symbolcurrency
需要注意的是,从该函数检索的数据以固定频率出现,与财务期间内提供数据的确切日期无关。对于公司的股息、分拆和每股收益 (EPS) 信息,可以通过 request.dividends()、 request.splits()和 request.earnings()请求按确切日期报告的数据。
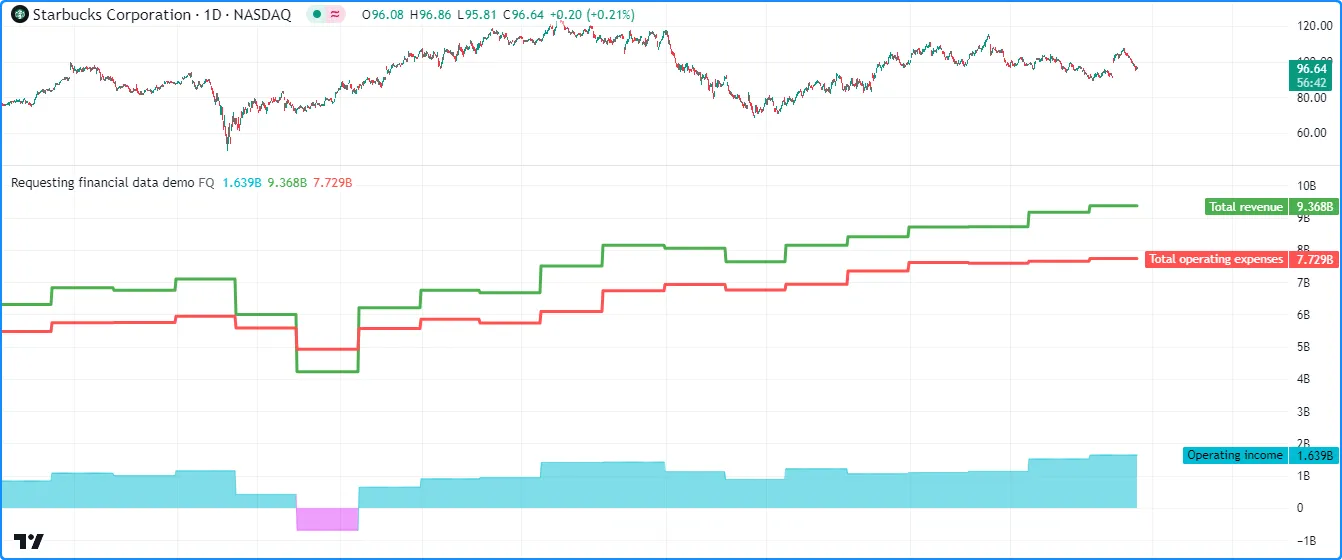
此脚本使用
request.financial()
检索股票发行公司的收入和支出信息,并可视化其典型业务运营的盈利能力。它请求
最新的syminfo.tickerid的
“OPER_INCOME”、“TOTAL_REVENUE”和“TOTAL_OPER_EXPENSE”财务 ID,然后
将结果绘制在图表上:fiscalPeriod
//@version=5
indicator("Requesting financial data demo", format = format.volume)

//@variable The size of the fiscal reporting period. Some options may not be available, depending on the instrument.
string fiscalPeriod = input.string("FQ", "Period", ["FQ", "FH", "FY", "TTM"])

//@variable The operating income after expenses reported for the stock's issuing company.
float operatingIncome = request.financial(syminfo.tickerid, "OPER_INCOME", fiscalPeriod)
//@variable The total revenue reported for the stock's issuing company.
float totalRevenue = request.financial(syminfo.tickerid, "TOTAL_REVENUE", fiscalPeriod)
//@variable The total operating expenses reported for the stock's issuing company.
float totalExpenses = request.financial(syminfo.tickerid, "TOTAL_OPER_EXPENSE", fiscalPeriod)

//@variable Is aqua when the `totalRevenue` exceeds the `totalExpenses`, fuchsia otherwise.
color incomeColor = operatingIncome > 0 ? color.new(color.aqua, 50) : color.new(color.fuchsia, 50)

// Display the requested data.
plot(operatingIncome, "Operating income", incomeColor, 1, plot.style_area)
plot(totalRevenue, "Total revenue", color.green, 3)
plot(totalExpenses, "Total operating expenses", color.red, 3)
注意:
- 并非所有
fiscalPeriod选项都适用于每个股票代码。例如,美国公司通常发布 季度报告,而许多欧洲公司则发布 半年报告。请参阅 我们帮助中心的此页面了解更多信息。
计算财务指标
request.financial()函数 可以为脚本提供大量有用的财务指标,这些指标无需额外计算。但是,一些常用的财务估算需要将工具的当前市场价格与请求的财务数据相结合。例如:
- 市值(市场价格 * 流通股总数)
- 收益率(12个月每股收益/市场价格)
- 市净率(市场价格/BVPS)
- 市盈率(市场价格/每股收益)
- 市销率(市值/12 个月总收入)
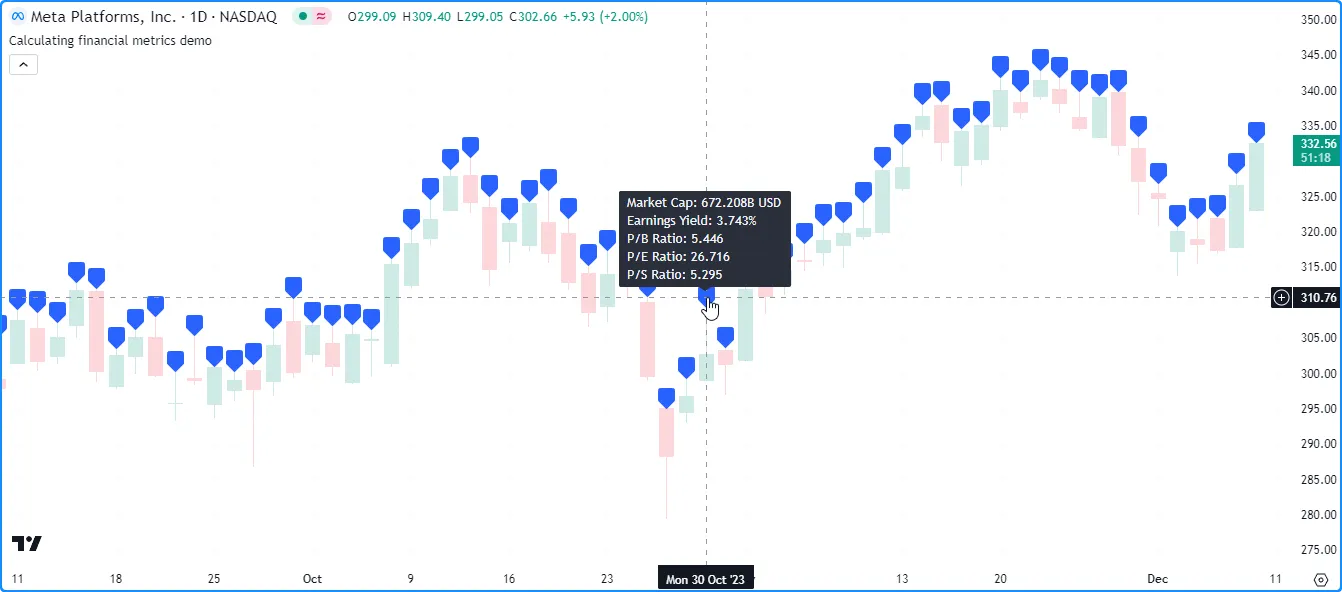
以下脚本包含
用户定义函数,用于计算syminfo.tickerid的上述财务指标
。我们创建了这些函数,以便用户可以轻松地将它们复制到他们的脚本中。此示例在
str.format()
调用中使用它们来构造一个,它使用标签tooltipText在图表上的工具提示中显示。将鼠标悬停在任何条形图的
标签上将
显示包含该条形图上计算的指标的工具提示:
//@version=5
indicator("Calculating financial metrics demo", overlay = true, max_labels_count = 500)

//@function Calculates the market capitalization (market cap) for the chart's symbol.
marketCap() =>
    //@variable The most recent number of outstanding shares reported for the symbol.
    float totalSharesOutstanding = request.financial(syminfo.tickerid, "TOTAL_SHARES_OUTSTANDING", "FQ")
    // Return the market cap value.
    totalSharesOutstanding * close

//@function Calculates the Earnings Yield for the chart's symbol.
earningsYield() =>
    //@variable The most recent 12-month earnings per share reported for the symbol.
    float eps = request.financial(syminfo.tickerid, "EARNINGS_PER_SHARE", "TTM")
    //Return the Earnings Yield percentage.
    100.0 * eps / close

//@function Calculates the Price-to-Book (P/B) ratio for the chart's symbol.
priceBookRatio() =>
    //@variable The most recent Book Value Per Share (BVPS) reported for the symbol.
    float bookValuePerShare = request.financial(syminfo.tickerid, "BOOK_VALUE_PER_SHARE", "FQ")
    // Return the P/B ratio.
    close / bookValuePerShare

//@function Calculates the Price-to-Earnings (P/E) ratio for the chart's symbol.
priceEarningsRatio() =>
    //@variable The most recent 12-month earnings per share reported for the symbol.
    float eps = request.financial(syminfo.tickerid, "EARNINGS_PER_SHARE", "TTM")
    // Return the P/E ratio.
    close / eps

//@function Calculates the Price-to-Sales (P/S) ratio for the chart's symbol.
priceSalesRatio() =>
    //@variable The most recent number of outstanding shares reported for the symbol.
    float totalSharesOutstanding = request.financial(syminfo.tickerid, "TOTAL_SHARES_OUTSTANDING", "FQ")
    //@variable The most recent 12-month total revenue reported for the symbol.
    float totalRevenue = request.financial(syminfo.tickerid, "TOTAL_REVENUE", "TTM")
    // Return the P/S ratio.
    totalSharesOutstanding * close / totalRevenue

//@variable The text to display in label tooltips.
string tooltipText = str.format(
     "Market Cap: {0} {1}\nEarnings Yield: {2}%\nP/B Ratio: {3}\nP/E Ratio: {4}\nP/S Ratio: {5}",
     str.tostring(marketCap(), format.volume), syminfo.currency, earningsYield(), priceBookRatio(),
     priceEarningsRatio(), priceSalesRatio()
 )

//@variable Displays a blank label with a tooltip containing the `tooltipText`.
label info = label.new(chart.point.now(high), tooltip = tooltipText)
注意:
- 由于并非所有公司都会发布季度财务报告,因此可能需要更改这些函数中的“FQ”以匹配特定公司的最低报告期,因为 当“FQ”数据不可用时,request.financial() 调用将返回 na 。
财务ID
以下是可通过request.financial()请求的所有财务指标的概述 ,以及报告可用的时间段。我们将这些信息分为四个表格,与“指标”菜单的“财务”部分中显示的类别相对应:
每个表均包含以下三列:
- 第一列包含每个指标的描述,并带有指向帮助中心页面的链接以获取更多信息。
- 第二列列出了
period该指标允许的可能参数。请注意,所有可用值可能并不与特定的股票代码 ID 兼容,例如,虽然“FQ”可能是一个可能的参数,但如果发行公司不发布季度数据,它将不起作用。 - 第三列列出了request.financial()
financial_id中参数 的“字符串”ID 。
收入报表
该表列出了提供有关公司收入、成本、利润和损失信息的指标。
点击显示/隐藏
| 金融的 | period | financial_id |
|---|---|---|
| 税后其他收入/支出 | FQ、FH、FY、TTM | 税后其他收入 |
| 平均基本流通股数 | FQ、FH、FY | 基本股份未清偿 |
| 基本每股收益(Basic EPS) | FQ、FH、FY、TTM | 每股收益基本 |
| 销售成本 | FQ、FH、FY、TTM | 产品的成本 |
| 折旧和摊销 | FQ、FH、FY、TTM | 违约金_支出_收益 |
| 稀释每股收益(稀释 EPS) | FQ、FH、FY、TTM | 稀释每股收益 |
| 普通股股东可获得的稀释净利润 | FQ、FH、FY、TTM | 稀释净收入 |
| 摊薄后流通股数 | FQ、FH、FY | 稀释流通股数 |
| 稀释调整 | FQ、FH、FY、TTM | 稀释调整 |
| 停止运营 | FQ、FH、FY、TTM | 已停止运营 |
| 息税前利润 | FQ、FH、FY、TTM | 息税前利润 |
| 息税折旧摊销前利润 | FQ、FH、FY、TTM | 息税折旧摊销前利润 |
| 收益权益 | FQ、FH、FY、TTM | 股权收益 |
| 毛利 | FQ、FH、FY、TTM | 毛利 |
| 利息资本化 | FQ、FH、FY、TTM | 利息_大写 |
| 债务利息支出 | FQ、FH、FY、TTM | 债务利息支出 |
| 利息费用,扣除资本化利息 | FQ、FH、FY、TTM | 非经营性利息 |
| 杂项非营业费用 | FQ、FH、FY、TTM | 其他的收入 |
| 净利 | FQ、FH、FY、TTM | 净利 |
| 停止经营前的净利润 | FQ、FH、FY、TTM | 净收入_BEF_DISC_OPER |
| 非控股/少数股东权益 | FQ、FH、FY、TTM | 少数群体利益指数 |
| 营业外收入(不包括利息支出) | FQ、FH、FY、TTM | 非营业收入 |
| 营业外收入总计 | FQ、FH、FY、TTM | 总非营业收入 |
| 营业外利息收入 | FQ、FH、FY、TTM | 非营业利息收入 |
| 营业费用(不含销货成本) | FQ、FH、FY、TTM | 营业费用 |
| 营业收入 | FQ、FH、FY、TTM | 营业收入 |
| 其他销售成本 | FQ、FH、FY、TTM | 商品成本(扣除利息摊销) |
| 其他运营费用总计 | FQ、FH、FY、TTM | 其他运营费用总计 |
| 优先股息 | FQ、FH、FY、TTM | 优先股股息 |
| 税前收益权益 | FQ、FH、FY、TTM | 税前权益收益 |
| 税前收入 | FQ、FH、FY、TTM | 税前收入 |
| 研究和发展 | FQ、FH、FY、TTM | 研究与开发 |
| 销售/一般/管理费用,其他 | FQ、FH、FY、TTM | 出售_GEN_ADMIN_EXP_OTHER |
| 销售/一般/管理费用总计 | FQ、FH、FY、TTM | 销售管理经验总计 |
| 税费 | FQ、FH、FY、TTM | 所得税 |
| 总营业费用 | FQ、FH、FY、TTM | 总运营费用 |
| 总收入 | FQ、FH、FY、TTM | 总收入 |
| 不寻常的收入/支出 | FQ、FH、FY、TTM | 异常支出 |
资产负债表
该表列出了提供有关公司资本结构信息的指标。
点击显示/隐藏
| 金融的 | period | financial_id |
|---|---|---|
| 应付账款 | FQ、FH、FY | 应付账款 |
| 应收账款 - 贸易,净额 | FQ、FH、FY | 应收账款净额 |
| 应计工资 | FQ、FH、FY | 应计工资单 |
| 累计折旧总额 | FQ、FH、FY | 累计折旧总额 |
| 额外实收资本/资本公积 | FQ、FH、FY | 资本的额外支付 |
| 每股账面价值 | FQ、FH、FY | 每股账面价值 |
| 资本和经营租赁义务 | FQ、FH、FY | 资本经营租赁义务 |
| 资本化租赁义务 | FQ、FH、FY | 资本租赁义务 |
| 现金等价物 | FQ、FH、FY | 现金等价物 |
| 现金和短期投资 | FQ、FH、FY | 现金和短期投资 |
| 普通股权益总额 | FQ、FH、FY | 普通股权益总额 |
| 普通股面值/账面价值 | FQ、FH、FY | 普通股票标准价 |
| 长期债务和资本租赁的当前部分 | FQ、FH、FY | 当前港口债务资本租赁 |
| 递延收入,当前 | FQ、FH、FY | 递延收入当前 |
| 递延收入,非流动 | FQ、FH、FY | 递延收入_非当前 |
| 递延税项资产 | FQ、FH、FY | 递延税项资产 |
| 递延所得税负债 | FQ、FH、FY | 递延所得税负债 |
| 应付股息 | 财年 | 应付股息 |
| 商誉净额 | FQ、FH、FY | 善意 |
| 物业/厂房/设备总额 | FQ、FH、FY | PPE_TOTAL_GROSS |
| 应缴所得税 | FQ、FH、FY | 应缴所得税 |
| 库存-成品 | FQ、FH、FY | 库存成品 |
| 库存 - 进度款及其他 | FQ、FH、FY | 库存进度付款 |
| 库存-原材料 | FQ、FH、FY | 库存原材料 |
| 库存 - 在制品 | FQ、FH、FY | 库存工作正在进行中 |
| 对非合并子公司的投资 | FQ、FH、FY | 未合并的投资 |
| 长期债务 | FQ、FH、FY | 长期债务 |
| 长期债务(不包括租赁负债) | FQ、FH、FY | 长期债务扣除资本租赁 |
| 长期投资 | FQ、FH、FY | 长期投资 |
| 少数股东权益 | FQ、FH、FY | 少数股东权益 |
| 净债务 | FQ、FH、FY | 净债务 |
| 净无形资产 | FQ、FH、FY | 无形资产净值 |
| 净资产/厂房/设备 | FQ、FH、FY | PPE 总净值 |
| 应收票据-长期 | FQ、FH、FY | 长期应收票据 |
| 应付票据 | 财年 | 短期债务支付票据 |
| 经营租赁负债 | FQ、FH、FY | 经营租赁负债 |
| 其他普通股 | FQ、FH、FY | 其他普通股 |
| 其他流动资产总计 | FQ、FH、FY | 其他当前资产总计 |
| 其他流动负债 | FQ、FH、FY | 其他流动负债 |
| 其他无形资产净值 | FQ、FH、FY | 其他无形资产净值 |
| 其他投资 | FQ、FH、FY | 其他投资 |
| 其他长期资产总计 | FQ、FH、FY | 长期其他资产总计 |
| 其他非流动负债总计 | FQ、FH、FY | 其他负债总额 |
| 其他应收款 | FQ、FH、FY | 其他应收账款 |
| 其他短期债务 | 财年 | 其他短期债务 |
| 实收资本 | FQ、FH、FY | 实收资本 |
| 优先股,账面价值 | FQ、FH、FY | 首选库存价值 |
| 预付的费用 | FQ、FH、FY | 预付的费用 |
| 风险准备及费用 | FQ、FH、FY | 准备金风险 |
| 留存收益 | FQ、FH、FY | 留存收益 |
| 股东权益 | FQ、FH、FY | 权益 |
| 短期债务 | FQ、FH、FY | 短期债务 |
| 短期债务(不包括长期债务的流动部分) | FQ、FH、FY | 短期债务扣除当前端口 |
| 短期投资 | FQ、FH、FY | 短期投资 |
| 每股有形账面价值 | FQ、FH、FY | 每份有形书籍 |
| 总资产 | FQ、FH、FY | 总资产 |
| 流动资产总额 | FQ、FH、FY | 流动资产总额 |
| 流动负债总额 | FQ、FH、FY | 流动负债总额 |
| 总债务 | FQ、FH、FY | 总债务 |
| 总权益 | FQ、FH、FY | 总权益 |
| 总库存 | FQ、FH、FY | 总库存 |
| 负债总额 | FQ、FH、FY | 负债总额 |
| 负债及股东权益合计 | FQ、FH、FY | 总负债_SHRHLDRS_权益 |
| 非流动资产总计 | FQ、FH、FY | 非流动资产总计 |
| 非流动负债总额 | FQ、FH、FY | 非流动负债总额 |
| 应收账款总额,净额 | FQ、FH、FY | 应收账款净总额 |
| 库存股 - 普通股 | FQ、FH、FY | 国库券_普通股 |
现金周转
下表列出了可用的指标,可提供有关公司现金流动情况的信息。
点击显示/隐藏
| 金融的 | period | financial_id |
|---|---|---|
| 摊销 | FQ、FH、FY、TTM | 摊销 |
| 资本支出 | FQ、FH、FY、TTM | 资本支出 |
| 资本支出-固定资产 | FQ、FH、FY、TTM | 资本支出固定资产 |
| 资本支出-其他资产 | FQ、FH、FY、TTM | 资本支出其他资产 |
| 筹资活动产生的现金 | FQ、FH、FY、TTM | 现金融资活动 |
| 投资活动产生的现金 | FQ、FH、FY、TTM | 现金投资活动 |
| 经营活动产生的现金 | FQ、FH、FY、TTM | 现金运营活动 |
| 应付账款变动 | FQ、FH、FY、TTM | 更改应付账款 |
| 应收账款变动 | FQ、FH、FY、TTM | 应收账款变化 |
| 应计费用的变化 | FQ、FH、FY、TTM | 应计费用的变化 |
| 库存变化 | FQ、FH、FY、TTM | 库存变化 |
| 其他资产/负债的变化 | FQ、FH、FY、TTM | 其他资产的变化 |
| 应付税款变化 | FQ、FH、FY、TTM | 应缴税款变化 |
| 营运资本变化 | FQ、FH、FY、TTM | 营运资本变化 |
| 已支付的普通股股息 | FQ、FH、FY、TTM | 普通股股息现金流 |
| 递延税项(现金流) | FQ、FH、FY、TTM | 现金流递延税项 |
| 折旧和摊销(现金流) | FQ、FH、FY、TTM | 现金流折旧摊销 |
| 折旧/耗竭 | FQ、FH、FY、TTM | 折旧消耗 |
| 融资活动-其他来源 | FQ、FH、FY、TTM | 其他融资现金流来源 |
| 融资活动-其他用途 | FQ、FH、FY、TTM | 其他融资现金流用途 |
| 自由现金流 | FQ、FH、FY、TTM | 自由现金流 |
| 营运资金 | FQ、FH、FY、TTM | 资金运作 |
| 投资活动-其他来源 | FQ、FH、FY、TTM | 其他投资现金流来源 |
| 投资活动-其他用途 | FQ、FH、FY | 其他投资现金流用途 |
| 发行长期债务 | FQ、FH、FY、TTM | 提供长期债务 |
| 债务发行/偿还净额 | FQ、FH、FY、TTM | 债务净发行 |
| 发行/偿还长期债务 | FQ、FH、FY、TTM | 发行长期债务 |
| 发行/偿还其他债务 | FQ、FH、FY、TTM | 发行其他债务 |
| 发行/偿还短期债务 | FQ、FH、FY、TTM | 发行短期债务 |
| 股票发行/退出净额 | FQ、FH、FY、TTM | 股票发行净额 |
| 净收入(现金流) | FQ、FH、FY、TTM | 净收入起始线 |
| 非现金物品 | FQ、FH、FY、TTM | 非现金物品 |
| 其他融资现金流量项目总计 | FQ、FH、FY、TTM | 其他融资现金流项目总计 |
| 其他投资现金流项目总计 | FQ、FH、FY | 其他投资现金流项目总计 |
| 已支付优先股股息 | FQ、FH、FY | 优先股息现金流 |
| 购买投资 | FQ、FH、FY、TTM | 购买投资 |
| 购买/收购业务 | FQ、FH、FY、TTM | 购买业务 |
| 购买/出售业务净额 | FQ、FH、FY | 购买_销售_业务 |
| 购买/出售投资净额 | FQ、FH、FY、TTM | 购买_销售_投资 |
| 减少长期债务 | FQ、FH、FY、TTM | 减少长期债务 |
| 回购普通股和优先股 | FQ、FH、FY、TTM | 购买库存 |
| 出售普通股和优先股 | FQ、FH、FY、TTM | 库存销售 |
| 出售固定资产和业务 | FQ、FH、FY、TTM | 业务销售额 |
| 投资出售/到期 | FQ、FH、FY | 投资销售额 |
| 已支付的现金股息总额 | FQ、FH、FY、TTM | 已支付现金股息总额 |
统计数据
该表包含各种统计指标,包括常用的财务比率。
点击显示/隐藏
| 金融的 | period | financial_id |
|---|---|---|
| 应计项目 | FQ、FH、FY | 应计比率 |
| Altman Z 分数 | FQ、FH、FY | ALTMAN_Z_分数 |
| 资产周转率 | FQ、FH、FY | 资产周转率 |
| Beneish M 评分 | FQ、FH、FY | 贝内什分数 |
| 回购收益率 % | FQ、FH、FY | 回购收益 |
| 销货成本与收入比率 | FQ、FH、FY | 营业收入与成本之比 |
| 现金转换周期 | 财务季度、财务年度 | 现金转换周期 |
| 现金负债比率 | FQ、FH、FY | 现金转债务 |
| 目前的比例 | FQ、FH、FY | 目前的比例 |
| 库存天数 | 财务季度、财务年度 | 发明日 |
| 应付天数 | 财务季度、财务年度 | 付款天数 |
| 应收账款周转天数 | 财务季度、财务年度 | 日销售量 |
| 债务与 EBITDA 比率 | FQ、FH、FY | 债务与息税折旧摊销前利润 |
| 资产负债率 | FQ、FH、FY | 债务与资产 |
| 负债权益比率 | FQ、FH、FY | 债权转股权 |
| 债务收入比 | FQ、FH、FY | 债务与收入之比 |
| 股息支付率 % | FQ、FH、FY、TTM | 股息支付率 |
| 股息收益率 % | FQ、FH、FY | 股息收益率 |
| 每股股息 - 普通股首次发行 | FQ、FH、FY、TTM | DPS_COMMON_STOCK_PRIM_ISSUE |
| EBITDA 利润率 % | FQ、FH、FY、TTM | EBITDA 利润率 |
| EPS基本一年增长 | FQ、FH、FY、TTM | 每股基本收益一年增长 |
| EPS 摊薄一年增长 | FQ、FH、FY | 每股收益逐年递减 |
| 每股收益预测 | FQ、FH、FY | 预计收入 |
| 债务实际利率 % | FQ、FH、FY | 债务实际利率 |
| 企业价值 | FQ、FH、FY | 企业价值 |
| 企业价值与息税前利润之比 | FQ、FH、FY | 企业利润 |
| 企业价值与 EBITDA 比率 | FQ、FH、FY | 企业价值 EBITDA |
| 企业价值与收入比率 | FQ、FH、FY | 企业收入 |
| 权益与资产比率 | FQ、FH、FY | 股权与资产之比 |
| 流通股数 | 财年 | 流通股数 |
| 自由现金流利润率 % | FQ、FH、FY | 自由现金流保证金 |
| 富尔默 H 因子 | 财务季度、财务年度 | FULMER_H_FACTOR |
| 商誉与资产比率 | FQ、FH、FY | 资产信誉 |
| 格雷厄姆数 | 财务季度、财务年度 | 格雷厄姆数字 |
| 毛利率 % | FQ、FH、FY、TTM | 毛利率 |
| 毛利与资产比率 | 财务季度、财务年度 | 资产毛利润 |
| 利息覆盖率 | FQ、FH、FY | INTERST_COVER |
| 库存收入比 | FQ、FH、FY | 发明创造转化为收入 |
| 存货周转率 | FQ、FH、FY | 发明周转率 |
| KZ 指数 | 财年 | KZ_索引 |
| 长期负债与总资产比率 | FQ、FH、FY | 长期资产负债 |
| 每股净流动资产值 | 财务季度、财务年度 | NCAVPS_比率 |
| 每位员工的净收入 | 财年 | 每位员工的净收入 |
| 净利润率 % | FQ、FH、FY、TTM | 净保证金 |
| 在职员工人数 | 财年 | 在职员工人数 |
| 营业收益率 % | FQ、FH、FY | 营业利润率 |
| 营业利润率 % | FQ、FH、FY | 营业利润率 |
| 市盈率与增长率 (PEG) 比率 | 财务季度、财务年度 | 市盈率与增长率 |
| Piotroski F 分数 | FQ、FH、FY | 皮奥特罗斯基分数 |
| 市盈率预测 | 财务季度、财务年度 | 预期价格收益 |
| 价格销售比率前进 | 财务季度、财务年度 | 价格销售预测 |
| 质量比 | FQ、FH、FY | 质量比率 |
| 速动比率 | FQ、FH、FY | 速动比率 |
| 研发与收入比率 | FQ、FH、FY | 研究与开发以实现收益 |
| 资产收益率 % | FQ、FH、FY | 资产收益率 |
| 普通股权益回报率 % | FQ、FH、FY | 普通股回报率 |
| 股本回报率 % | FQ、FH、FY | 股本回报率 |
| 调整至账面价值的股本回报率 % | FQ、FH、FY | 调整后股权回报率 |
| 投资资本回报率 % | FQ、FH、FY | 投资回报率 |
| 有形资产回报率 % | FQ、FH、FY | 资产回报率 |
| 有形权益回报率 % | FQ、FH、FY | 股权回报率 |
| 收入估算 | FQ、FH、FY | 销售估算 |
| 收入一年增长 | FQ、FH、FY、TTM | 收入一年增长 |
| 每位员工的收入 | 财年 | 每位员工的收入 |
| 股票回购比例 % | FQ、FH、FY | 股票回购比率 |
| 斯隆比率 % | FQ、FH、FY | 斯隆比率 |
| Springate 评分 | 财务季度、财务年度 | SPRINGATE_SCORE |
| 可持续增长率 | 财务季度、财务年度 | 可持续增长率 |
| 有形普通股权益比率 | FQ、FH、FY | 有形普通股权益比率 |
| 托宾 Q 值(近似值) | FQ、FH、FY | TOBIN_Q_比率 |
| 已发行普通股总数 | FQ、FH、FY | 已发行股份总数 |
| Zmijewski 评分 | 财务季度、财务年度 | 兹米杰夫斯基分数 |
`request.economic()`
request.economic () 函数使脚本能够检索指定国家或地区的经济数据,包括有关经济状况(GDP、通货膨胀率等)或特定行业(钢铁产量、ICU 床位等)的信息。
以下是该函数的签名:
request.economic(country_code, field, gaps, ignore_invalid_symbol) → series float该country_code参数接受一个“简单字符串”,表示要请求经济数据的国家或地区的标识符(例如“美国”、“欧盟”等)。请参阅
国家/地区代码部分,了解此函数支持的代码的完整列表。请注意,可用的经济指标取决于函数调用中指定的国家或地区。
该field参数指定函数将请求的指标。
字段代码部分涵盖所有可访问的指标以及它们适用的国家/地区。
有关该函数最后两个参数的详细说明,请参阅 本页顶部的常见特性部分。
这个简单的例子使用request.economic()请求美国(“US”)的国内生产总值(“GDPQQ”)的增长率 ,然后用渐变颜色在图表上绘制其值:
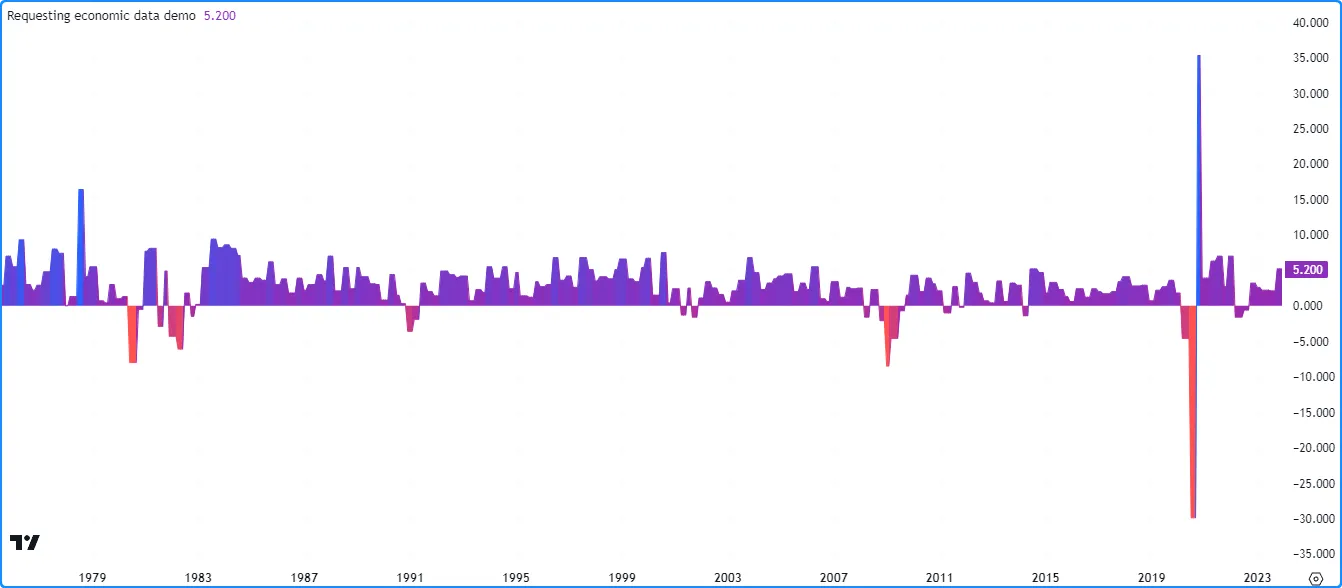
//@version=5
indicator("Requesting economic data demo")

//@variable The GDP growth rate for the US economy.
float gdpqq = request.economic("US", "GDPQQ")

//@variable The all-time maximum growth rate.
float maxRate = ta.max(gdpqq)
//@variable The all-time minimum growth rate.
float minRate = ta.min(gdpqq)

//@variable The color of the `gdpqq` plot.
color rateColor = switch
    gdpqq >= 0 => color.from_gradient(gdpqq, 0, maxRate, color.purple, color.blue)
    =>            color.from_gradient(gdpqq, minRate, 0, color.red, color.purple)

// Plot the results.
plot(gdpqq, "US GDP Growth Rate", rateColor, style = plot.style_area)
注意:
- 此示例未
gaps在 request.economic() 调用中包含参数,因此该函数使用默认的 barmerge.gaps_off。换句话说,当新数据尚不可用时,它会返回最后检索到的值。
国家/地区代码
本节中的表格列出了可与 request.economic()一起使用的所有国家/地区代码。表格的第一列包含代表国家或地区代码的“字符串”值,第二列包含相应的国家/地区名称。
值得注意的是,用作参数的值决定了函数可以访问country_code
哪些
字段代码。
点击显示/隐藏
country_code | 国家/地区名称 |
|---|---|
| 自动对焦 | 阿富汗 |
| 艾尔 | 阿尔巴尼亚 |
| 大正 | 阿尔及利亚 |
| 广告 | 安道尔 |
| AO | 安哥拉 |
| 银 | 安提瓜和巴布达 |
| 应收账款 | 阿根廷 |
| 是 | 亚美尼亚 |
| 噢 | 阿鲁巴 |
| 非盟 | 澳大利亚 |
| 在 | 奥地利 |
| 亚利桑那州 | 阿塞拜疆 |
| 学士学位 | 巴哈马 |
| 波黑 | 巴林 |
| 屋宇署 | 孟加拉国 |
| BB | 巴巴多斯 |
| 经过 | 白俄罗斯 |
| 是 | 比利时 |
| 巴兹 | 伯利兹 |
| 北京 | 贝宁 |
| 马来亚 | 百慕大 |
| 英国电信 | 不丹 |
| 鲍尔 | 玻利维亚 |
| 文学士 | 波斯尼亚和黑塞哥维那 |
| 体重 | 博茨瓦纳 |
| 巴西雷亚尔 | 巴西 |
| 国阵 | 文莱 |
| 保利 | 保加利亚 |
| 高炉 | 布基纳法索 |
| 双 | 布隆迪 |
| 凯赫 | 柬埔寨 |
| 厘米 | 喀麦隆 |
| 加州 | 加拿大 |
| 简历 | 佛得角 |
| 肯塔基州 | 开曼群岛 |
| CF | 中非共和国 |
| 道明 | 乍得 |
| 氯 | 智利 |
| 中国 | 中国 |
| 一氧化碳 | 哥伦比亚 |
| 知识管理 | 科摩罗 |
| CG | 刚果 |
| 碳排放 | 哥斯达黎加 |
| 人力资源 | 克罗地亚 |
| CU | 古巴 |
| CY | 塞浦路斯 |
| 捷克共和国 | 捷克共和国 |
| 丹麦 | 丹麦 |
| DJ | 吉布提 |
| 糖尿病 | 多米尼加 |
| 做 | 多明尼加共和国 |
| 順利 | 东帝汶 |
| 电子商务 | 厄瓜多尔 |
| 例如 | 埃及 |
| SV | 萨尔瓦多 |
| GQ | 赤道几内亚 |
| 急诊室 | 厄立特里亚 |
| 电子工程 | 爱沙尼亚 |
| 等 | 埃塞俄比亚 |
| 欧洲联盟 | 欧元区 |
| 福 | 法罗群岛 |
| 缩略词 | 斐济 |
| 财务信息 | 芬兰 |
| 法国 | 法国 |
| 遗传算法 | 加蓬 |
| 通用汽车 | 冈比亚 |
| 通用电气 | 乔治亚州 |
| 德 | 德国 |
| 生长激素 | 加纳 |
| 生长素 | 希腊 |
| GL | 格陵兰 |
| 广东 | 格林纳达 |
| 燃气涡轮 | 危地马拉 |
| 肾小球肾炎 | 几内亚 |
| 毛里求斯 | 几内亚比绍 |
| 贵阳 | 圭亚那 |
| H T | 海地 |
| 氢 | 洪都拉斯 |
| 香港 | 香港 |
| 胡 | 匈牙利 |
| 是 | 冰岛 |
| 在 | 印度 |
| ID | 印度尼西亚 |
| 红外线 | 伊朗 |
| 智商 | 伊拉克 |
| IE | 爱尔兰 |
| 我是 | 马恩岛 |
| 白细胞介素 | 以色列 |
| 它 | 意大利 |
| CI | 象牙海岸 |
| 吉姆 | 牙买加 |
| J.P | 日本 |
| 乔 | 约旦 |
| 喀什 | 哈萨克斯坦 |
| 柯尔特 | 肯尼亚 |
| 碘化钾 | 基里巴斯 |
| 西科 | 科索沃 |
| 千瓦 | 科威特 |
| 公斤 | 吉尔吉斯斯坦 |
| 洛杉矶 | 老挝 |
| 路威酩轩 | 拉脱维亚 |
| 磅 | 黎巴嫩 |
| LS | 莱索托 |
| 左心室 | 利比里亚 |
| 閣下 | 利比亚 |
| 李 | 列支敦士登 |
| LT | 立陶宛 |
| 鲁 | 卢森堡 |
| 莫 | 澳门 |
| MK | 马其顿 |
| MG | 马达加斯加 |
| 兆瓦 | 马拉维 |
| 我的 | 马来西亚 |
| MV | 马尔代夫 |
| 机器学习 | 马里 |
| 公吨 | 马耳他 |
| 先生 | 毛里塔尼亚 |
| 亩 | 毛里求斯 |
| 墨西哥 | 墨西哥 |
| 医学博士 | 摩尔多瓦 |
| 国会议员 | 摩纳哥 |
| 明尼苏达州 | 蒙古 |
| 我 | 黑山 |
| 嘛 | 摩洛哥 |
| 麦哲伦 | 莫桑比克 |
| 毫米 | 缅甸 |
| 不适用 | 纳米比亚 |
| 名词解释 | 尼泊尔 |
| 荷兰 | 荷兰 |
| 数控 | 新喀里多尼亚 |
| 新西兰 | 新西兰 |
| 你 | 尼加拉瓜 |
| 东北 | 尼日尔 |
| 天然气 | 尼日利亚 |
| 关键政策 | 北朝鲜 |
| 不 | 挪威 |
| 奥姆 | 阿曼 |
| PK | 巴基斯坦 |
| 附言 | 巴勒斯坦 |
| 宾夕法尼亚州 | 巴拿马 |
| 前列腺素 | 巴布亚新几内亚 |
| 磷 | 巴拉圭 |
| 聚乙烯 | 秘鲁 |
| 肺动脉高压 | 菲律宾 |
| 波兰 | 波兰 |
| 太平洋标准时间 | 葡萄牙 |
| 公共关系 | 波多黎各 |
| 质量保证 | 卡塔尔 |
| 光盘 | 刚果共和国 |
| 反渗透 | 罗马尼亚 |
| 俄罗斯 | 俄罗斯 |
| RW | 卢旺达 |
| WS | 萨摩亚 |
| 山猫 | 圣马力诺 |
| 英石 | 圣多美和普林西比 |
| 南非 | 沙特阿拉伯 |
| 序号 | 塞内加尔 |
| 遥感 | 塞尔维亚 |
| 南卡罗来纳州 | 塞舌尔 |
| SL | 塞拉利昂 |
| 新加坡 | 新加坡 |
| SK | 斯洛伐克 |
| 国际单位制 | 斯洛文尼亚 |
| 巴拿马 | 所罗门群岛 |
| 所以 | 索马里 |
| 南非 | 南非 |
| 韩国 | 韩国 |
| SS | 南苏丹 |
| ES | 西班牙 |
| 莱克 | 斯里兰卡 |
| LC | 圣卢西亚 |
| 风险投资 | 圣文森特和格林纳丁斯 |
| 标准差 | 苏丹 |
| 简写 | 苏里南 |
| 深圳 | 斯威士兰 |
| 东南 | 瑞典 |
| 中 | 瑞士 |
| 韓國 | 叙利亚 |
| 台湾 | 台湾 |
| TJ | 塔吉克斯坦 |
| 泰泽 | 坦桑尼亚 |
| 頓 | 泰国 |
| 甘油三酸酯 | 多哥 |
| 到 | 汤加 |
| TT | 特立尼达和多巴哥 |
| 田纳西州 | 突尼斯 |
| 贸易 | 火鸡 |
| TM值 | 土库曼斯坦 |
| 本科 | 乌干达 |
| UA | 乌克兰 |
| 声发射 | 阿拉伯联合酋长国 |
| 英国 | 英国 |
| 我们 | 美国 |
| 尤因 | 乌拉圭 |
| 乌兹别克斯坦 | 乌兹别克斯坦 |
| 似曾相识 | 瓦努阿图 |
| 维生素E | 委内瑞拉 |
| 越南 | 越南 |
| 叶 | 也门 |
| 郑州 | 赞比亚 |
| 中 | 津巴布韦 |
域代码
本节中的表格列出了可用于
request.economic()的字段代码。第一列包含用作field
参数的“字符串”值,第二列包含每个指标的名称以及指向我们的帮助中心的链接,其中包含更多信息,包括它们适用的国家/地区。
点击显示/隐藏
`请求.seed()`
TradingView 从众多提供商处汇总了大量数据,包括可交易工具的价格和数量信息、财务数据、经济数据等,用户可以使用上面讨论的函数以及多个内置变量在 Pine Script™ 中检索这些数据。
为了进一步扩大可以在 TradingView 上分析的可能数据的范围,我们推出了Pine Seeds,它允许用户通过 GitHub 提供自定义的用户维护的EOD 数据源,以用于 TradingView 图表和 Pine Script™ 代码中。
要从脚本中的 Pine Seeds 数据源中检索数据,可以使用 request.seed() 函数。
以下是该函数的签名:
request.seed(source, symbol, expression, ignore_invalid_symbol, calc_bars_count) → series <type>该source参数指定包含数据馈送的用户维护的 GitHub 存储库的唯一名称。有关创建存储库的详细信息,请参阅此页面。
该symbol参数表示存储库“data/”目录中的文件名source,不包括“.csv”文件扩展名。
有关存储库中存储的数据结构的信息,请参阅此页面。
参数expression是使用从请求上下文中提取的数据来评估的系列。它类似于
request.security()
和
request.security_lower_tf()中的等效项。存储在用户维护的存储库中的数据馈送包含
时间、
开盘价、
最高价、
最低价、
收盘价和
成交量
信息,这意味着用作expression参数的表达式可以使用相应的内置变量,包括从它们派生的变量(例如
bar_index、
ohlc4等)从自定义数据的上下文中请求它们的值。
下面的脚本可视化了来自 seed_crypto_santiment 演示存储库的示例数据。它使用两次对 request.seed()的调用 来从存储库的 BTC_SENTIMENT_POSITIVE_TOTAL 和 BTC_SENTIMENT_NEGATIVE_TOTAL 数据源中 检索 收盘价,并将结果绘制在图表上作为阶梯线:
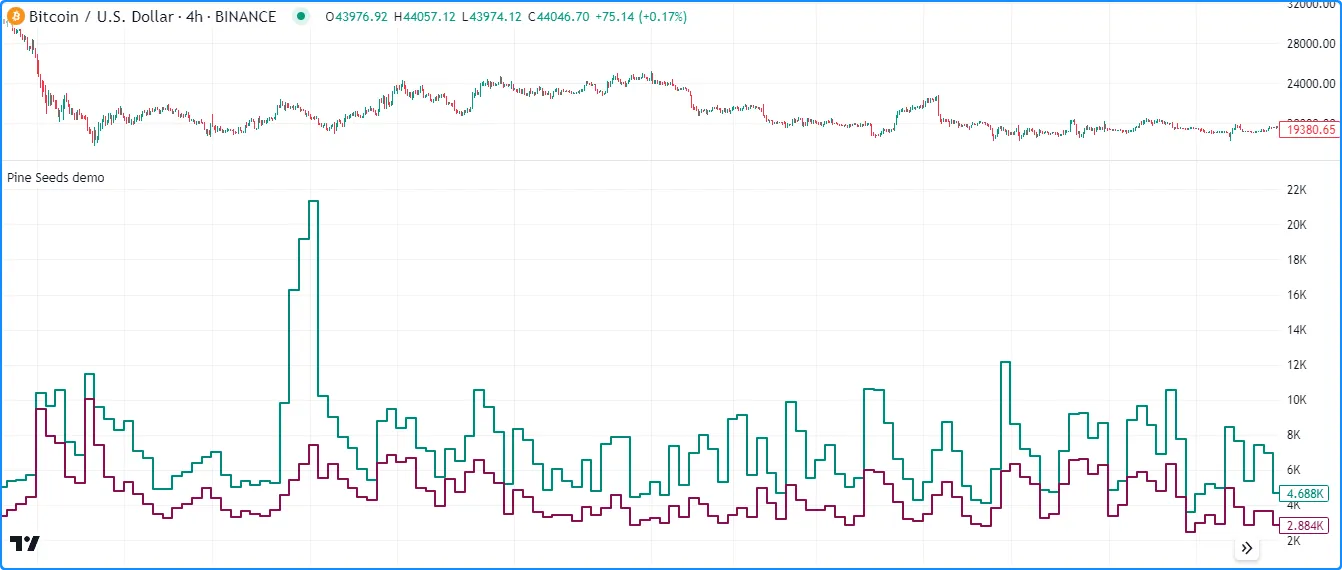
//@version=5
indicator("Pine Seeds demo", format=format.volume)

//@variable The total positive sentiment for BTC extracted from the "seed_crypto_santiment" repository.
float positiveTotal = request.seed("seed_crypto_santiment", "BTC_SENTIMENT_POSITIVE_TOTAL", close)
//@variable The total negative sentiment for BTC extracted from the "seed_crypto_santiment" repository.
float negativeTotal = request.seed("seed_crypto_santiment", "BTC_SENTIMENT_NEGATIVE_TOTAL", close)

// Plot the data.
plot(positiveTotal, "Positive sentiment", color.teal, 2, plot.style_stepline)
plot(negativeTotal, "Negative sentiment", color.maroon, 2, plot.style_stepline)
注意:
- 此示例从Pine Seeds 文档中突出显示的 repo 请求数据 。它仅用于示例目的,其数据不会 定期更新。
- 与大多数其他
request.*()函数不同, request.seed() 没有参数。 当没有新数据时,gaps它将始终返回 na值。 - 可以从图表的符号搜索栏中搜索 Pine Seeds 数据。要在图表上加载数据馈送,请输入“Repo:File”对,类似于搜索“Exchange:Symbol”对。