地图
介绍
Pine Script™ Maps 是以键值对形式存储元素的集合。它们允许脚本收集与唯一标识符(键)关联的多个值引用。
与数组和 矩阵不同,映射是无序集合。脚本通过引用放入映射中的键值对中的键来快速访问映射的值,而无需遍历内部索引。
映射的键可以是任何基本类型或枚举类型,其值可以是任何可用类型。映射不能直接使用其他集合(映射、数组或矩阵)作为值,但它们可以在其字段中保存包含这些数据结构的UDT实例。有关更多信息,请参阅本节。
与其他集合一样,映射最多可包含 100,000 个元素。由于映射中的每个键值对由两个元素(唯一键及其关联值)组成,因此映射最多可容纳 50,000 个键值对。
声明地图
Pine Script™ 使用以下语法来声明地图:
[var/varip ][map<keyType, valueType> ]<identifier> = <expression>其中<keyType, valueType>是映射的
类型模板,它声明了它将包含的键和值的类型,并且<expression>返回映射实例或na。
当声明一个分配给的 map 变量时na,用户必须包含
map
关键字,后跟
类型模板,以告诉编译器该变量可以接受带有
keyType键和valueType值的映射。
例如,这行代码声明了一个新myMap变量,该变量可以接受保存
字符串
键和
浮点
值对的映射实例:
map<string, float> myMap = na
当<expression>不是时na,编译器不需要显式的类型声明,因为它将从分配的映射对象中推断类型信息。
此行声明一个myMap变量,该变量分配给一个空映射,其键为
字符串
,
值是浮点数
。 稍后分配给此变量的任何映射都必须具有相同的键和值类型:
myMap = map.new<string, float>()
使用 `var` 和 `varip`关键字
用户可以使用 var或 varip 关键字来指示其脚本仅在第一个图表栏上声明地图变量。使用这些关键字的变量在每次脚本迭代中都指向相同的地图实例,直到明确重新分配为止。
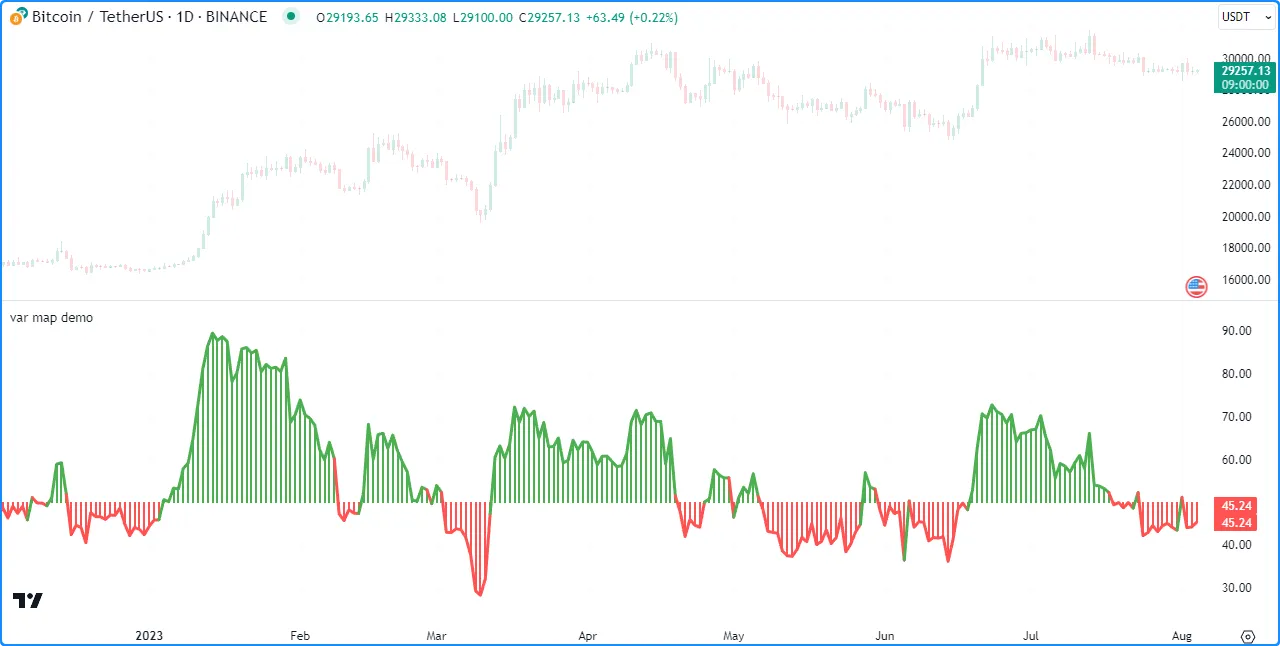
例如,此脚本声明一个colorMap分配给映射的变量,该映射包含
第一个图表条上的字符串
键和
颜色oscillator值对。该脚本在图表上显示,并使用它
放入第一个条
上colorMap的的值来为所有条上的图表着色:
//@version=5
indicator("var map demo")

//@variable A map associating color values with string keys.
var colorMap = map.new<string, color>()

// Put `<string, color>` pairs into `colorMap` on the first bar.
if bar_index == 0
    colorMap.put("Bull", color.green)
    colorMap.put("Bear", color.red)
    colorMap.put("Neutral", color.gray)

//@variable The 14-bar RSI of `close`.
float oscillator = ta.rsi(close, 14)

//@variable The color of the `oscillator`.
color oscColor = switch
    oscillator > 50 => colorMap.get("Bull")
    oscillator < 50 => colorMap.get("Bear")
    =>                 colorMap.get("Neutral")

// Plot the `oscillator` using the `oscColor` from our `colorMap`.
plot(oscillator, "Histogram", oscColor, 2, plot.style_histogram, histbase = 50)
plot(oscillator, "Line", oscColor, 3)
读写
放置和获取键值对
map.put()函数
是 map 用户经常使用的函数,因为它是将新的键值对放入 map 的主要方法。它将参数
key与value调用中的参数关联起来,并将该对添加到 map 中id。
如果map.put()key调用中的参数
在映射的
键中已经存在,则传递给函数的新对将替换现有的对。
id要从与给定 关联的映射中检索值key,请使用
map.get()id 。 如果映射
包含,则此函数返回该值
。key否则,它返回
na。
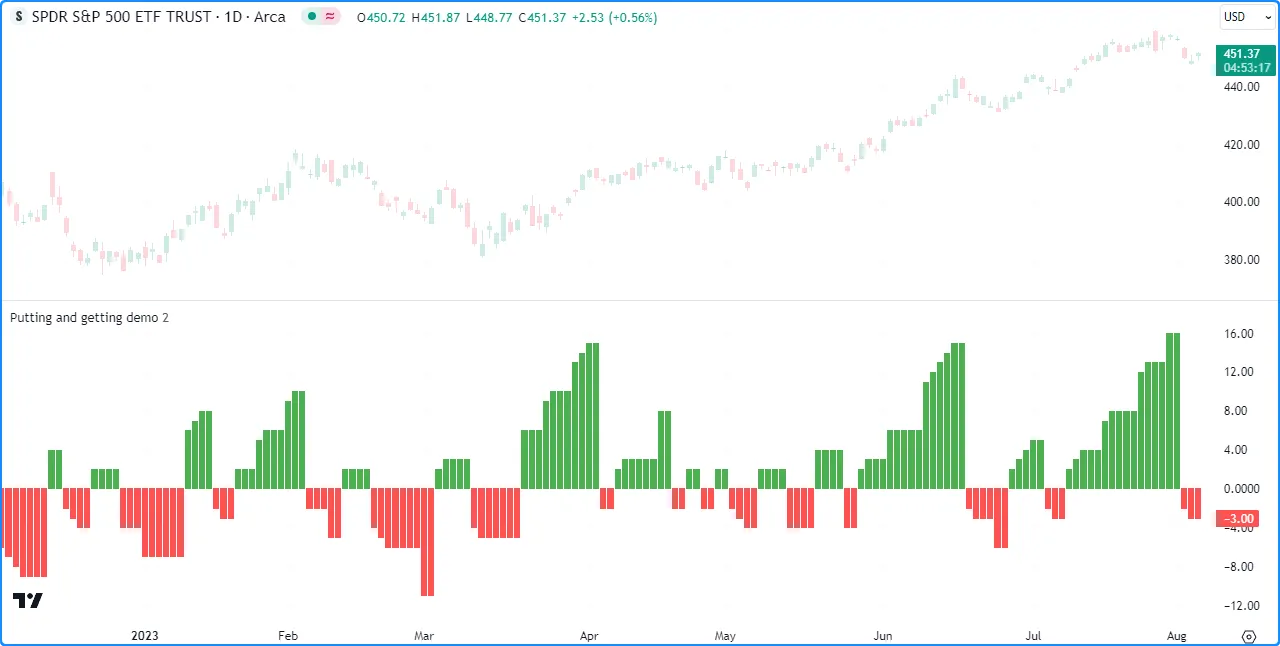
以下示例
借助
map.put()
和
map.get()
方法计算给
定时间内收盘价
上次
上涨
和
下跌时的bar_index
值
之间的差异
。当价格上涨时,脚本将一对放入地图中,当价格下跌时,脚本将一对放入地图中。然后,它将包含“上涨”和“下跌”值之间“差异”的一对放入地图中,并在图表上绘制其值:length("Rising", bar_index)data("Falling", bar_index)
//@version=5
indicator("Putting and getting demo")

//@variable The length of the `ta.rising()` and `ta.falling()` calculation.
int length = input.int(2, "Length")

//@variable A map associating `string` keys with `int` values.
var data = map.new<string, int>()

// Put a new ("Rising", `bar_index`) pair into the `data` map when `close` is rising.
if ta.rising(close, length)
    data.put("Rising", bar_index)
// Put a new ("Falling", `bar_index`) pair into the `data` map when `close` is falling.
if ta.falling(close, length)
    data.put("Falling", bar_index)

// Put the "Difference" between current "Rising" and "Falling" values into the `data` map.
data.put("Difference", data.get("Rising") - data.get("Falling"))

//@variable The difference between the last "Rising" and "Falling" `bar_index`.
int index = data.get("Difference")

//@variable Returns `color.green` when `index` is positive, `color.red` when negative, and `color.gray` otherwise.
color indexColor = index > 0 ? color.green : index < 0 ? color.red : color.gray

plot(index, color = indexColor, style = plot.style_columns)
注意:
- 该脚本在连续的data.put()调用中替换与“Rising”、“Falling”和“Difference”键相关的值
,因为每个键都是唯一的,并且在映射中只能出现一次
data。 - 替换映射中的对不会改变其键的内部 插入顺序。我们将在下一节中进一步讨论这一点 。
与处理其他集合类似,将
特殊类型
(line、
linefill、
box、
polyline、
label、
table或
chart.point)或
用户定义类型的值放入映射时,务必将插入的对的
value点标记为同一对象,而无需复制它。修改键值对引用的值也会影响原始对象。
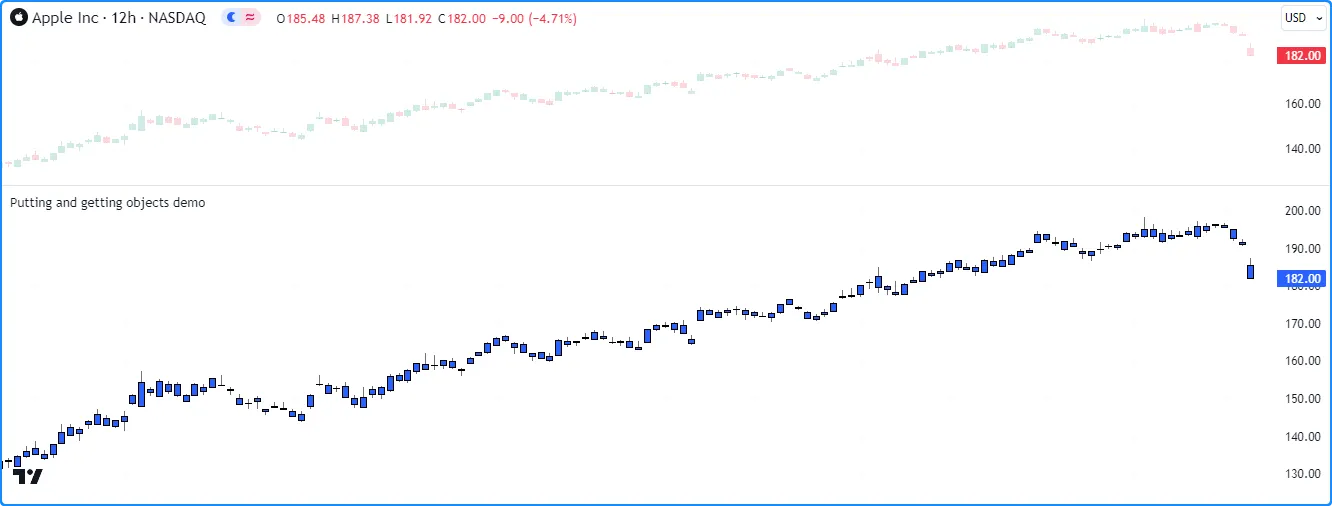
例如,此脚本包含一个自定义ChartData类型,其中包含o、
h、l和c字段。在第一个图表条上,脚本声明一个
myMap变量并添加对("A", myData),其中myData是一个
ChartData初始字段值为 的实例na。它通过用户定义的方法在每个条上将该对添加到
("B", myData)并myMap从该对中更新对象update()。
对具有“B”键的对象的每次更改都会影响由“A”键引用的对象,如“A”对象字段的烛台图所示:
//@version=5
indicator("Putting and getting objects demo")

//@type A custom type to hold OHLC data.
type ChartData
    float o
    float h
    float l
    float c

//@function Updates the fields of a `ChartData` object.
method update(ChartData this) =>
    this.o := open
    this.h := high
    this.l := low
    this.c := close

//@variable A new `ChartData` instance declared on the first bar.
var myData = ChartData.new()
//@variable A map associating `string` keys with `ChartData` instances.
var myMap = map.new<string, ChartData>()

// Put a new pair with the "A" key into `myMap` only on the first bar.
if bar_index == 0
    myMap.put("A", myData)

// Put a pair with the "B" key into `myMap` on every bar.
myMap.put("B", myData)

//@variable The `ChartData` value associated with the "A" key in `myMap`.
ChartData oldest = myMap.get("A")
//@variable The `ChartData` value associated with the "B" key in `myMap`.
ChartData newest = myMap.get("B")

// Update `newest`. Also affects `oldest` and `myData` since they all reference the same `ChartData` object.
newest.update()

// Plot the fields of `oldest` as candles.
plotcandle(oldest.o, oldest.h, oldest.l, oldest.c)
注意:
- 如果此脚本将 的副本传递
myData给每个 myMap.put() 调用,则其行为会有所不同。有关更多信息,请参阅 我们用户手册中有关对象的页面的 此部分。
检查键和值
`map.keys()` 和`map.values()`
要检索放入映射中的所有键和值,请使用
map.keys()
和
map.values()。这些函数将映射中的所有键/值引用复制id到新的
数组
对象。修改这两个函数返回的数组都不会影响映射id。
尽管地图是无序集合,但 Pine Script™ 内部会维护地图键值对的
插入顺序。因此, map.keys()
和
map.values()
函数始终返回数组,其元素根据id地图的插入顺序排序。
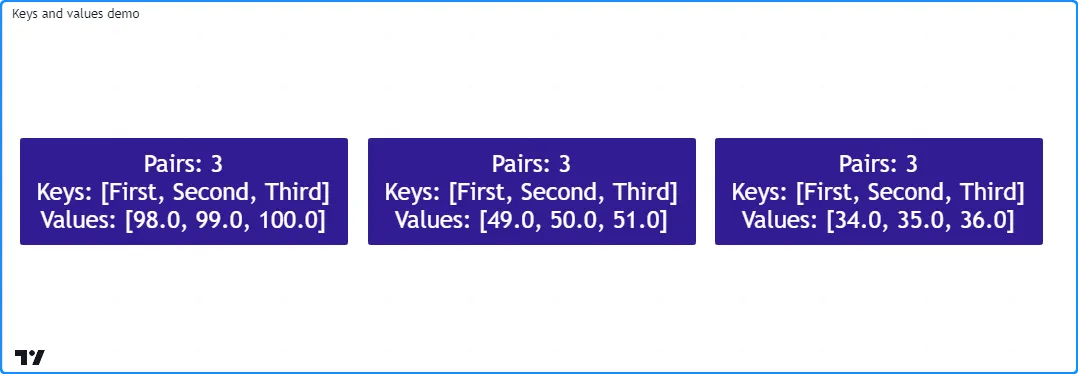
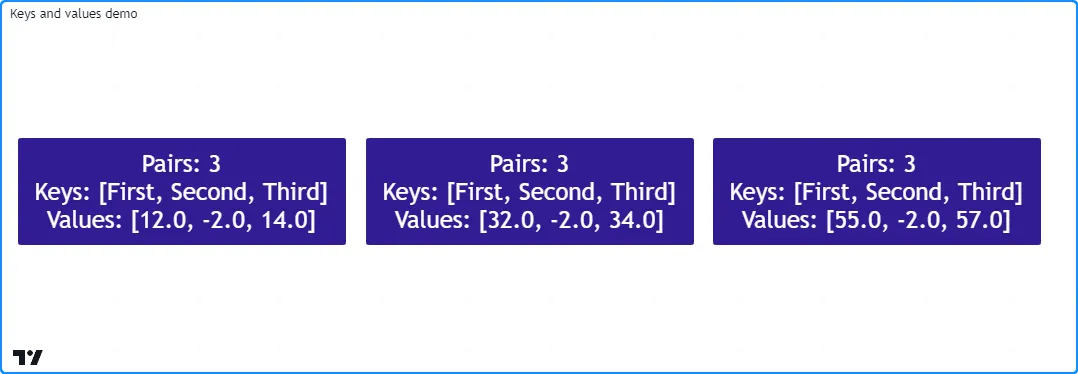
下面的脚本通过每 50 个条形图在标签m中显示一次地图
中的键和值数组来演示这一点
。正如我们在图表上看到的,和 返回的每个数组中元素的顺序与中键值对的插入顺序一致:m.keys()m.values()m
//@version=5
indicator("Keys and values demo")

if bar_index % 50 == 0
    //@variable A map containing pairs of `string` keys and `float` values.
    m = map.new<string, float>()

    // Put pairs into `m`. The map will maintain this insertion order.
    m.put("First", math.round(math.random(0, 100)))
    m.put("Second", m.get("First") + 1)
    m.put("Third", m.get("Second") + 1)

    //@variable An array containing the keys of `m` in their insertion order.
    array<string> keys = m.keys()
    //@variable An array containing the values of `m` in their insertion order.
    array<float> values = m.values()

    //@variable A label displaying the `size` of `m` and the `keys` and `values` arrays.
    label debugLabel = label.new(
         bar_index, 0,
         str.format("Pairs: {0}\nKeys: {1}\nValues: {2}", m.size(), keys, values),
         color = color.navy, style = label.style_label_center,
         textcolor = color.white, size = size.huge
     )
注意:
- “First” 键的值是 0 到 100 之间的随机 整数。“Second” 值比“First” 大一,“Third” 值比“Second” 大一。
需要注意的是, 替换键值对时, 映射的内部插入顺序不会改变。在这种情况下, keys() 和 values() 数组中新元素的位置将与旧元素相同。唯一的例外是脚本事先完全 删除了键。
下面,我们添加了一行代码,将
具有“Second”键的新值放入m映射中,覆盖与该键关联的先前值。尽管脚本将这个新对放入具有“Third”键的映射之后,但该对的键和值在keys和数组中仍然排在第二位,因为在更改之前values该键已经存在:m
//@version=5
indicator("Keys and values demo")

if bar_index % 50 == 0
    //@variable A map containing pairs of `string` keys and `float` values.
    m = map.new<string, float>()

    // Put pairs into `m`. The map will maintain this insertion order.
    m.put("First", math.round(math.random(0, 100)))
    m.put("Second", m.get("First") + 1)
    m.put("Third", m.get("Second") + 1)

    // Overwrite the "Second" pair in `m`. This will NOT affect the insertion order.
    // The key and value will still appear second in the `keys` and `values` arrays.
    m.put("Second", -2)

    //@variable An array containing the keys of `m` in their insertion order.
    array<string> keys = m.keys()
    //@variable An array containing the values of `m` in their insertion order.
    array<float> values = m.values()

    //@variable A label displaying the `size` of `m` and the `keys` and `values` arrays.
    label debugLabel = label.new(
         bar_index, 0,
         str.format("Pairs: {0}\nKeys: {1}\nValues: {2}", m.size(), keys, values),
         color = color.navy, style = label.style_label_center,
         textcolor = color.white, size = size.huge
     )
`map.contains()`
key要检查map 中是否存在特定项id,请使用
map.contains() 。此函数是针对map.keys()
返回的
数组
调用
array.includes()的便捷替代方法
。
例如,此脚本检查地图中是否存在各种键,然后在标签m中显示结果
:

//@version=5
indicator("Inspecting keys demo")

//@variable A map containing `string` keys and `string` values.
m = map.new<string, string>()

// Put key-value pairs into the map.
m.put("A", "B")
m.put("C", "D")
m.put("E", "F")

//@variable An array of keys to check for in `m`.
array<string> testKeys = array.from("A", "B", "C", "D", "E", "F")

//@variable An array containing all elements from `testKeys` found in the keys of `m`.
array<string> mappedKeys = array.new<string>()

for key in testKeys
    // Add the `key` to `mappedKeys` if `m` contains it.
    if m.contains(key)
        mappedKeys.push(key)

//@variable A string representing the `testKeys` array and the elements found within the keys of `m`.
string testText = str.format("Tested keys: {0}\nKeys found: {1}", testKeys, mappedKeys)

if bar_index == last_bar_index - 1
    //@variable Displays the `testText` in a label at the `bar_index` before the last.
    label debugLabel = label.new(
         bar_index, 0, testText, style = label.style_label_center,
         textcolor = color.white, size = size.huge
     )
删除键值对
要从 map 中删除特定的键值对id,请使用
map.remove()。此函数key从 map 中删除 及其关联值,同时保留其他键值对的插入顺序。如果 map 包含 ,则返回被删除的值
。否则key,返回
na。
id要一次性
从地图中删除所有键值对,请使用map.clear()。
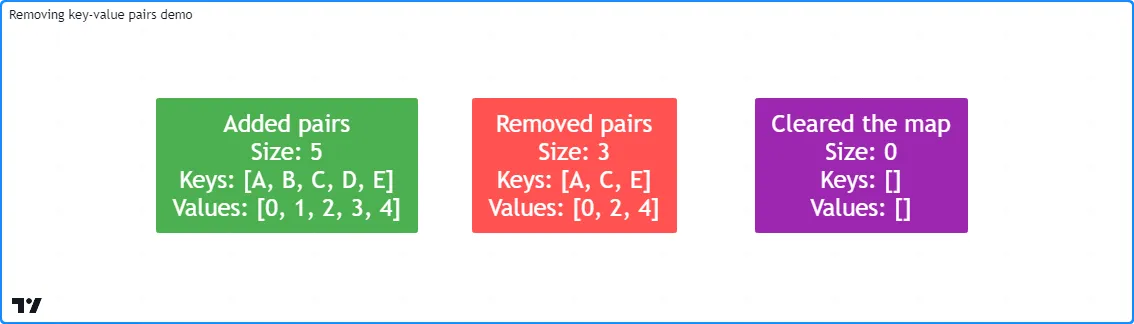
以下脚本创建一个新m映射,
将键值对放入映射中,
在循环中使用m.remove()key删除数组中列出的每个有效值removeKeys
,然后调用
m.clear()删除所有剩余
的
键值对。它使用自定义debugLabel()
方法在每次更改后显示
size、
keys和
valuesm:
//@version=5
indicator("Removing key-value pairs demo")

//@function Returns a label to display the keys and values from a map.
method debugLabel(
     map<string, int> this, int barIndex = bar_index,
     color bgColor = color.blue, string note = ""
 ) =>
    //@variable A string representing the size, keys, and values in `this` map.
    string repr = str.format(
         "{0}\nSize: {1}\nKeys: {2}\nValues: {3}",
         note, this.size(), str.tostring(this.keys()), str.tostring(this.values())
     )
    label.new(
         barIndex, 0, repr, color = bgColor, style = label.style_label_center,
         textcolor = color.white, size = size.huge
     )

if bar_index == last_bar_index - 1
    //@variable A map containing `string` keys and `int` values.
    m = map.new<string, int>()

    // Put key-value pairs into `m`.
    for [i, key] in array.from("A", "B", "C", "D", "E")
        m.put(key, i)
    m.debugLabel(bar_index, color.green, "Added pairs")

    //@variable An array of keys to remove from `m`.
    array<string> removeKeys = array.from("B", "B", "D", "F", "a")

    // Remove each `key` in `removeKeys` from `m`.
    for key in removeKeys
        m.remove(key)
    m.debugLabel(bar_index + 10, color.red, "Removed pairs")

    // Remove all remaining keys from `m`.
    m.clear()
    m.debugLabel(bar_index + 20, color.purple, "Cleared the map")
注意:
- 数组中的字符串并非全部
removeKeys都存在于 的键中m。尝试删除不存在的键(本例中为“F”、“a”和第二个“B”)对映射的内容没有影响。
合并地图
脚本可以通过
map.put_all()合并两个映射。此函数将映射中的所有键值对id2按其插入顺序放入id1映射中。与
map.put()一样,如果 中的任何键id2也存在于 中id1,则此函数
将替换包含这些键的键值对,而不会影响其初始插入顺序。
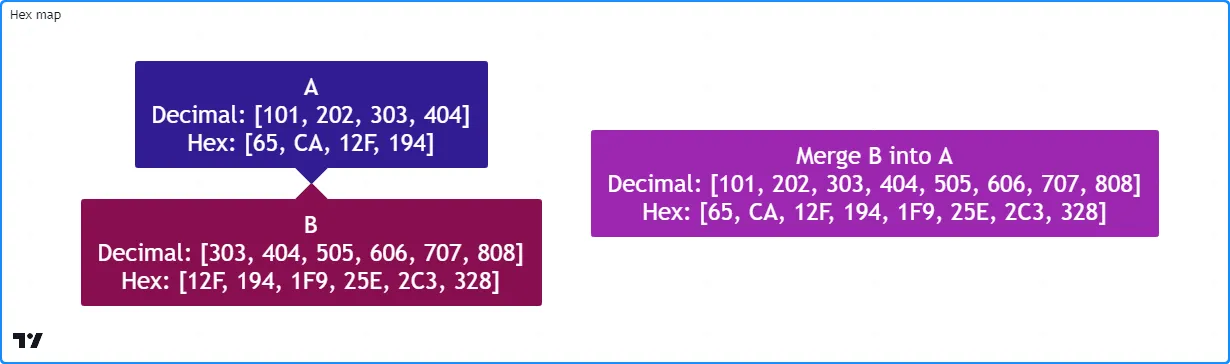
此示例包含一个用户定义hexMap()函数,该函数将十进制
int
键映射到
其
十六进制形式的字符串表示形式。脚本使用此函数创建两个映射,和,然后使用
mapA.put_all(mapB)
将所有键值对放入。mapAmapBmapBmapA
该脚本使用自定义debugLabel()函数来显示标签,其中显示 和
的键
和
值mapA,然后在将所有键值对放入其中后mapB,显示 的内容的另一个标签
:mapAmapB
//@version=5
indicator("Combining maps demo", "Hex map")

//@variable An array of string hex digits.
var array<string> hexDigits = str.split("0123456789ABCDEF", "")

//@function Returns a hexadecimal string for the specified `value`.
hex(int value) =>
    //@variable A string representing the hex form of the `value`.
    string result = ""
    //@variable A temporary value for digit calculation.
    int tempValue = value
    while tempValue > 0
        //@variable The next integer digit.
        int digit = tempValue % 16
        // Add the hex form of the `digit` to the `result`.
        result := hexDigits.get(digit) + result
        // Divide the `tempValue` by the base.
        tempValue := int(tempValue / 16)
    result

//@function Returns a map holding the `numbers` as keys and their `hex` strings as values.
hexMap(array<int> numbers) =>
    //@variable A map associating `int` keys with `string` values.
    result = map.new<int, string>()
    for number in numbers
        // Put a pair containing the `number` and its `hex()` representation into the `result`.
        result.put(number, hex(number))
    result

//@function Returns a label to display the keys and values of a hex map.
debugLabel(
     map<int, string> this, int barIndex = bar_index, color bgColor = color.blue,
     string style = label.style_label_center, string note = ""
 ) =>
    string repr = str.format(
         "{0}\nDecimal: {1}\nHex: {2}",
         note, str.tostring(this.keys()), str.tostring(this.values())
     )
    label.new(
         barIndex, 0, repr, color = bgColor, style = style,
         textcolor = color.white, size = size.huge
     )

if bar_index == last_bar_index - 1
    //@variable A map with decimal `int` keys and hexadecimal `string` values.
    map<int, string> mapA = hexMap(array.from(101, 202, 303, 404))
    debugLabel(mapA, bar_index, color.navy, label.style_label_down, "A")

    //@variable A map containing key-value pairs to add to `mapA`.
    map<int, string> mapB = hexMap(array.from(303, 404, 505, 606, 707, 808))
    debugLabel(mapB, bar_index, color.maroon, label.style_label_up, "B")

    // Put all pairs from `mapB` into `mapA`.
    mapA.put_all(mapB)
    debugLabel(mapA, bar_index + 10, color.purple, note = "Merge B into A")
循环浏览地图
脚本可以通过多种方式迭代访问映射中的键和值。例如,可以循环遍历映射的
keys()
数组并
get()
每个值key,如下所示:
for key in thisMap.keys()
    value = thisMap.get(key)
但是,我们建议for...in直接在映射上使用循环,因为它会按照插入顺序对映射的键值对进行迭代,并在每次迭代中返回包含下一对的键和值的元组。
例如,这行代码循环遍历 中的每个和
key,从输入的第一个键值对开始:valuethisMap
for [key, value] in thisMap
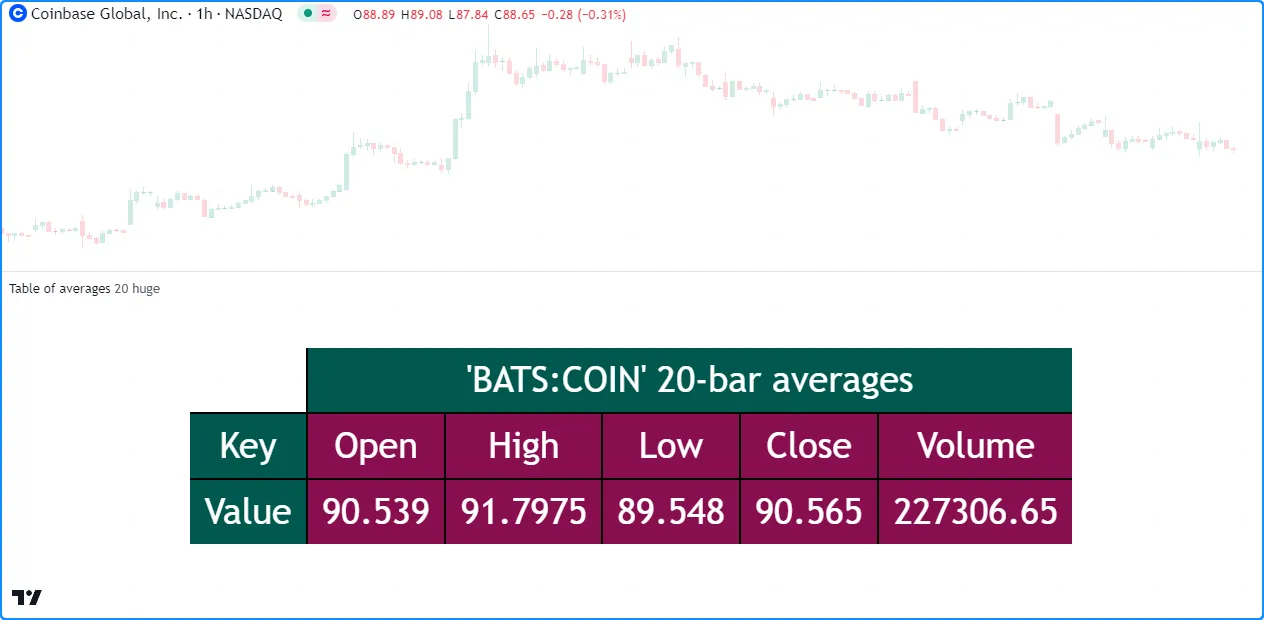
让我们使用此结构编写一个脚本,在表中显示地图的键值对
。在下面的示例中,我们定义了一个自定义toTable()方法,该方法创建一个
表,然后使用for...in循环遍历地图的键值对并填充表的单元格。该脚本使用此方法可视化包含价格和成交量数据的length地图:averages
//@version=5
indicator("Looping through a map demo", "Table of averages")

//@variable The length of the moving average.
int length = input.int(20, "Length")
//@variable The size of the table text.
string txtSize = input.string(
     size.huge, "Text size",
     options = [size.auto, size.tiny, size.small, size.normal, size.large, size.huge]
 )

//@function Displays the pairs of `this` map within a table.
//@param    this A map with `string` keys and `float` values.
//@param    position The position of the table on the chart.
//@param    header The string to display on the top row of the table.
//@param    textSize The size of the text in the table.
//@returns  A new `table` object with cells displaying each pair in `this`.
method toTable(
     map<string, float> this, string position = position.middle_center, string header = na,
     string textSize = size.huge
 ) =>
    // Color variables
    borderColor = #000000
    headerColor = color.rgb(1, 88, 80)
    pairColor   = color.maroon
    textColor   = color.white

    //@variable A table that displays the key-value pairs of `this` map.
    table result = table.new(
         position, this.size() + 1, 3, border_width = 2, border_color = borderColor
     )
    // Initialize top and side header cells.
    result.cell(1, 0, header, bgcolor = headerColor, text_color = textColor, text_size = textSize)
    result.merge_cells(1, 0, this.size(), 0)
    result.cell(0, 1, "Key", bgcolor = headerColor, text_color = textColor, text_size = textSize)
    result.cell(0, 2, "Value", bgcolor = headerColor, text_color = textColor, text_size = textSize)

    //@variable The column index of the table. Updates on each loop iteration.
    int col = 1

    // Loop over each `key` and `value` from `this` map in the insertion order.
    for [key, value] in this
        // Initialize a `key` cell in the `result` table on row 1.
        result.cell(
             col, 1, str.tostring(key), bgcolor = color.maroon,
             text_color = color.white, text_size = textSize
         )
        // Initialize a `value` cell in the `result` table on row 2.
        result.cell(
             col, 2, str.tostring(value), bgcolor = color.maroon,
             text_color = color.white, text_size = textSize
         )
        // Move to the next column index.
        col += 1
    result // Return the `result` table.

//@variable A map with `string` keys and `float` values to hold `length`-bar averages.
averages = map.new<string, float>()

// Put key-value pairs into the `averages` map.
averages.put("Open", ta.sma(open, length))
averages.put("High", ta.sma(high, length))
averages.put("Low", ta.sma(low, length))
averages.put("Close", ta.sma(close, length))
averages.put("Volume", ta.sma(volume, length))

//@variable The text to display at the top of the table.
string headerText = str.format("{0} {1}-bar averages", "'" + syminfo.tickerid + "'", length)
// Display the `averages` map in a `table` with the `headerText`.
averages.toTable(header = headerText, textSize = txtSize)
复制地图
浅拷贝
脚本可以使用
map.copy()函数对映射进行浅拷贝
。对浅拷贝的修改不会影响原始
映射或其内部插入顺序。idid
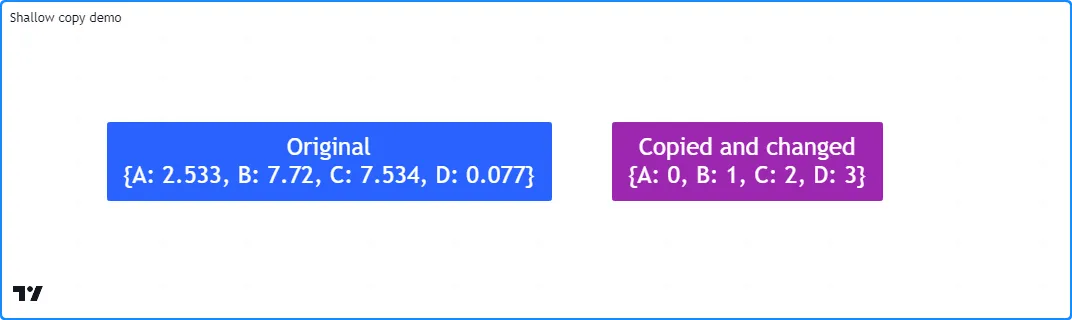
例如,此脚本构建一个m映射,其中键“A”、“B”、“C”和“D”分配给
0 到 10 之间的四个随机mCopy值。然后,它创建一个映射作为其键的浅表副本并更新与其键关联的值。该脚本使用我们的自定义方法在图表中和图表上m显示键值对:mmCopydebugLabel()
//@version=5
indicator("Shallow copy demo")

//@function Displays the key-value pairs of `this` map in a label.
method debugLabel(
     map<string, float> this, int barIndex = bar_index, color bgColor = color.blue,
     color textColor = color.white, string note = ""
 ) =>
    //@variable The text to display in the label.
    labelText = note + "\n{"
    for [key, value] in this
        labelText += str.format("{0}: {1}, ", key, value)
    labelText := str.replace(labelText, ", ", "}", this.size() - 1)

    if barstate.ishistory
        label result = label.new(
             barIndex, 0, labelText, color = bgColor, style = label.style_label_center,
             textcolor = textColor, size = size.huge
         )

if bar_index == last_bar_index - 1
    //@variable A map of `string` keys and random `float` values.
    m = map.new<string, float>()

    // Assign random values to an array of keys in `m`.
    for key in array.from("A", "B", "C", "D")
        m.put(key, math.random(0, 10))

    //@variable A shallow copy of `m`.
    mCopy = m.copy()

    // Assign the insertion order value `i` to each `key` in `mCopy`.
    for [i, key] in mCopy.keys()
        mCopy.put(key, i)

    // Display the labels.
    m.debugLabel(bar_index, note = "Original")
    mCopy.debugLabel(bar_index + 10, color.purple, note = "Copied and changed")
深层复制
虽然在复制具有 基本类型或枚举类型值的地图时,浅拷贝就足够了,但必须了解,保存特殊类型 (line、 linefill、 box、 polyline、 label、 table、 chart.point 或UDT)值的地图的浅拷贝指向与原始地图相同的对象。修改浅拷贝引用的对象将影响原始地图引用的实例,反之亦然。
为了确保对复制的映射所引用的对象的更改不会影响其他位置引用的实例,可以通过创建一个新的映射来进行深度复制,该新映射的键值对包含原始映射中每个值的副本。
此示例创建了一个字符串
键和
标签
值
original的映射
,并将
一个键值对放入其中。脚本通过
内置的
copy()
方法将映射复制到变量,然后使用自定义方法复制到变量。shallowdeepdeepCopy()
正如我们从图表中看到的,对从副本检索到的标签的更改
shallow也会影响地图引用的实例original
,但对来自副本的标签的更改deep不会:

//@version=5
indicator("Deep copy demo")

//@function Returns a deep copy of `this` map.
method deepCopy(map<string, label> this) =>
    //@variable A deep copy of `this` map.
    result = map.new<string, label>()
    // Add key-value pairs with copies of each `value` to the `result`.
    for [key, value] in this
        result.put(key, value.copy())
    result //Return the `result`.

//@variable A map containing `string` keys and `label` values.
var original = map.new<string, label>()

if bar_index == last_bar_index - 1
    // Put a new key-value pair into the `original` map.
    map.put(
         original, "Test",
         label.new(bar_index, 0, "Original", textcolor = color.white, size = size.huge)
     )

    //@variable A shallow copy of the `original` map.
    map<string, label> shallow = original.copy()
    //@variable A deep copy of the `original` map.
    map<string, label> deep = original.deepCopy()

    //@variable The "Test" label from the `shallow` copy.
    label shallowLabel = shallow.get("Test")
    //@variable The "Test" label from the `deep` copy.
    label deepLabel = deep.get("Test")

    // Modify the "Test" label's `y` attribute in the `original` map.
    // This also affects the `shallowLabel`.
    original.get("Test").set_y(label.all.size())

    // Modify the `shallowLabel`. Also modifies the "Test" label in the `original` map.
    shallowLabel.set_text("Shallow copy")
    shallowLabel.set_color(color.red)
    shallowLabel.set_style(label.style_label_up)

    // Modify the `deepLabel`. Does not modify any other label instance.
    deepLabel.set_text("Deep copy")
    deepLabel.set_color(color.navy)
    deepLabel.set_style(label.style_label_left)
    deepLabel.set_x(bar_index + 5)
注意:
范围和历史
与 Pine 中的其他集合一样,地图变量会在每个条形图上留下历史轨迹,从而允许脚本使用历史引用运算符 []访问分配给变量的过去地图实例。脚本还可以将地图分配给全局变量,并从函数、 方法和 条件结构的范围与它们进行交互 。
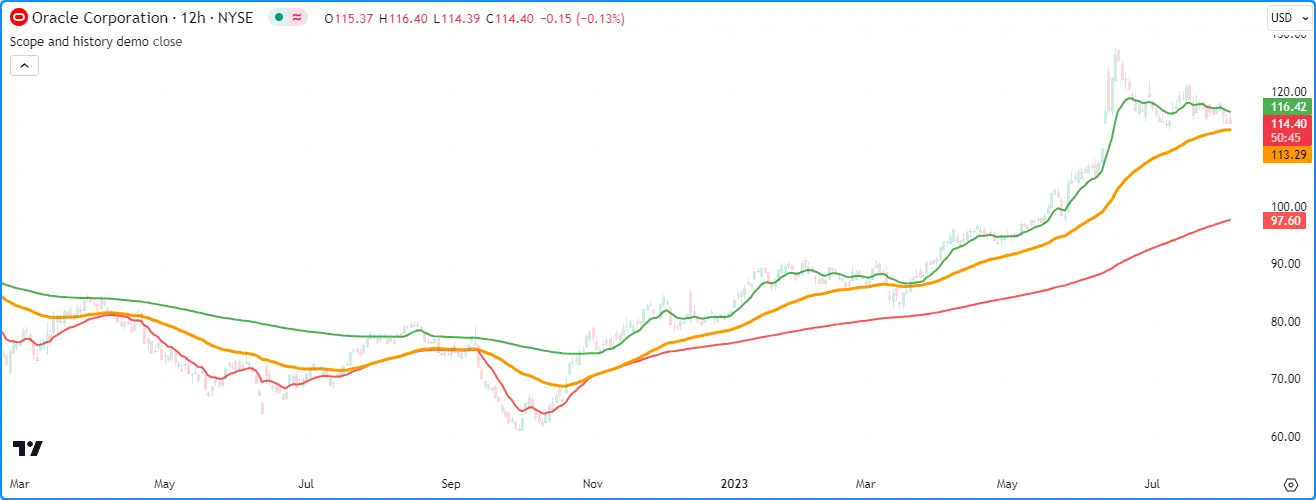
举例来说,此脚本使用全局映射及其历史记录来计算
EMA的集合。它声明了一个int
键和
浮点globalData值的映射
,其中映射中的每个键对应于每个 EMA 计算的长度。用户定义的函数通过将分配给的映射中的值与当前值混合来计算每个
长度 EMA 。update()keypreviousglobalDatasource
该脚本绘制了
全局地图的
values()数组中的最大值
和
最小值以及来自(即 50 条 EMA)
的值:globalData.get(50)
//@version=5
indicator("Scope and history demo", overlay = true)

//@variable The source value for EMA calculation.
float source = input.source(close, "Source")

//@variable A map containing global key-value pairs.
globalData = map.new<int, float>()

//@function Calculates a set of EMAs and updates the key-value pairs in `globalData`.
update() =>
    //@variable The previous map instance assigned to `globalData`.
    map<int, float> previous = globalData[1]

    // Put key-value pairs with keys 10-200 into `globalData` if `previous` is `na`.
    if na(previous)
        for i = 10 to 200
            globalData.put(i, source)
    else
        // Iterate each `key` and `value` in the `previous` map.
        for [key, value] in previous
            //@variable The smoothing parameter for the `key`-length EMA.
            float alpha = 2.0 / (key + 1.0)
            //@variable The `key`-length EMA value.
            float ema = (1.0 - alpha) * value + alpha * source
            // Put the `key`-length `ema` into the `globalData` map.
            globalData.put(key, ema)

// Update the `globalData` map.
update()

//@variable The array of values from `globalData` in their insertion order.
array<float> values = globalData.values()

// Plot the max EMA, min EMA, and 50-bar EMA values.
plot(values.max(), "Max EMA", color.green, 2)
plot(values.min(), "Min EMA", color.red, 2)
plot(globalData.get(50), "50-bar EMA", color.orange, 3)
其他藏品的地图
映射不能直接使用其他映射、 数组或 矩阵作为值,但它们可以保存包含字段内的集合的用户定义类型的值 。
例如,假设我们要创建一个“2D”映射,使用
字符串
键来访问包含
字符串
键和
浮点值对的嵌套映射
。由于映射不能使用其他集合作为值,我们将首先创建一个带有字段的包装器类型来保存
实例,如下所示:map<string, float>
//@type A wrapper type for maps with `string` keys and `float` values.
type Wrapper
    map<string, float> data
定义好类型后Wrapper,我们可以创建
字符串
键和Wrapper值的映射,其中data映射中每个值的字段指向一个map<string, float>实例:
mapOfMaps = map.new<string, Wrapper>()
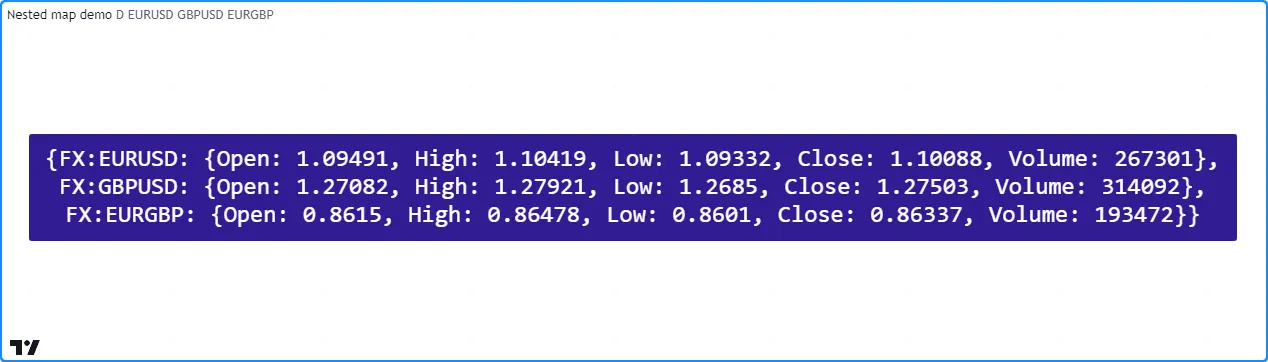
下面的脚本使用此概念构建一个映射,其中包含保存从多个股票行情机请求的 OHLCV 数据的映射。用户定义
requestData()函数从股票行情机请求价格和交易量数据,创建一个<string, float>映射,
将
数据放入其中,然后返回一个Wrapper包含新映射的实例。
该脚本
将
每次调用的结果requestData()放入mapOfMaps,然后
使用用户定义的方法创建嵌套映射的字符串toString()表示形式
,并将其显示在图表的
标签中:
//@version=5
indicator("Nested map demo")

//@variable The timeframe of the requested data.
string tf = input.timeframe("D", "Timeframe")
// Symbol inputs.
string symbol1 = input.symbol("EURUSD", "Symbol 1")
string symbol2 = input.symbol("GBPUSD", "Symbol 2")
string symbol3 = input.symbol("EURGBP", "Symbol 3")

//@type A wrapper type for maps with `string` keys and `float` values.
type Wrapper
    map<string, float> data

//@function Returns a wrapped map containing OHLCV data from the `tickerID` at the `timeframe`.
requestData(string tickerID, string timeframe) =>
    // Request a tuple of OHLCV values from the specified ticker and timeframe.
    [o, h, l, c, v] = request.security(
         tickerID, timeframe,
         [open, high, low, close, volume]
     )
    //@variable A map containing requested OHLCV data.
    result = map.new<string, float>()
    // Put key-value pairs into the `result`.
    result.put("Open", o)
    result.put("High", h)
    result.put("Low", l)
    result.put("Close", c)
    result.put("Volume", v)
    //Return the wrapped `result`.
    Wrapper.new(result)

//@function Returns a string representing `this` map of `string` keys and `Wrapper` values.
method toString(map<string, Wrapper> this) =>
    //@variable A string representation of `this` map.
    string result = "{"

    // Iterate over each `key1` and associated `wrapper` in `this`.
    for [key1, wrapper] in this
        // Add `key1` to the `result`.
        result += key1

        //@variable A string representation of the `wrapper.data` map.
        string innerStr = ": {"
        // Iterate over each `key2` and associated `value` in the wrapped map.
        for [key2, value] in wrapper.data
            // Add the key-value pair's representation to `innerStr`.
            innerStr += str.format("{0}: {1}, ", key2, str.tostring(value))

        // Replace the end of `innerStr` with "}" and add to `result`.
        result += str.replace(innerStr, ", ", "},\n", wrapper.data.size() - 1)

    // Replace the blank line at the end of `result` with "}".
    result := str.replace(result, ",\n", "}", this.size() - 1)
    result

//@variable A map of wrapped maps containing OHLCV data from multiple tickers.
var mapOfMaps = map.new<string, Wrapper>()

//@variable A label showing the contents of the `mapOfMaps`.
var debugLabel = label.new(
     bar_index, 0, color = color.navy, textcolor = color.white, size = size.huge,
     style = label.style_label_center, text_font_family = font.family_monospace
 )

// Put wrapped maps into `mapOfMaps`.
mapOfMaps.put(symbol1, requestData(symbol1, tf))
mapOfMaps.put(symbol2, requestData(symbol2, tf))
mapOfMaps.put(symbol3, requestData(symbol3, tf))

// Update the label.
debugLabel.set_text(mapOfMaps.toString())
debugLabel.set_x(bar_index)