调试
介绍
TradingView 将 Pine Editor 与图表界面紧密集成,有助于高效、交互式地调试 Pine Script™ 代码,因为脚本可以在图表内外的多个位置产生动态结果。程序员可以利用这些结果来改进脚本的行为,并确保一切按预期运行。
当程序员了解检查编写脚本时可能遇到的各种行为的适当技术时,他们可以快速彻底地识别和解决代码中的潜在问题,从而实现更无缝的整体编码体验。本页演示了使用 Pine Script™ 时调试代码的一些最方便的方法。
地形
Pine 脚本可以以多种不同的方式输出其结果,程序员可以利用其中任何一种方式进行调试。
该plot*()函数可以在图表窗格、脚本的状态行、价格(y 轴)刻度和数据窗口中显示结果,提供简单、方便的方法来调试数字和条件值:
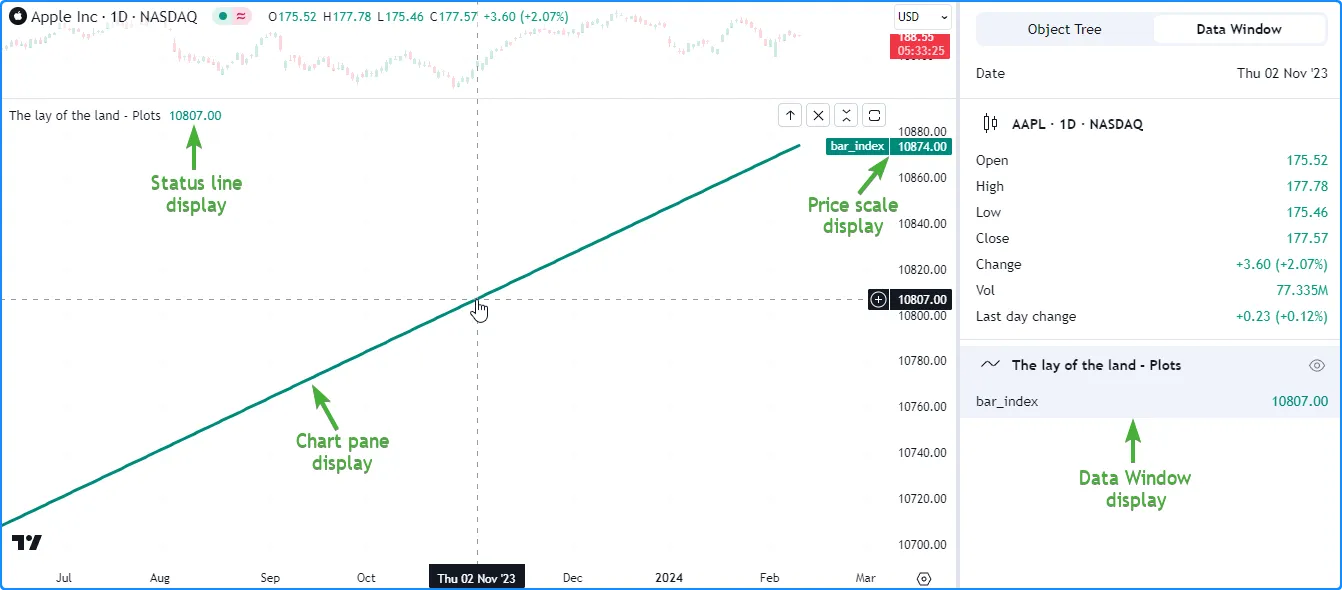
//@version=5
indicator("The lay of the land - Plots")

// Plot the `bar_index` in all available locations.
plot(bar_index, "bar_index", color.teal, 3)
注意:
- 仅当启用图表“状态行”设置的“指标”部分中的“值”复选框时,才会显示脚本的状态行输出。
- 仅当启用图表“刻度和线条”设置中的“指标和财务”下拉菜单中的选项时,价格刻度才会显示绘图值或名称。
bgcolor () 函数显示脚本窗格背景中的颜色, barcolor() 函数更改主图表的条形图或蜡烛图的颜色。这两个函数都提供了一种可视化条件的简单方法:
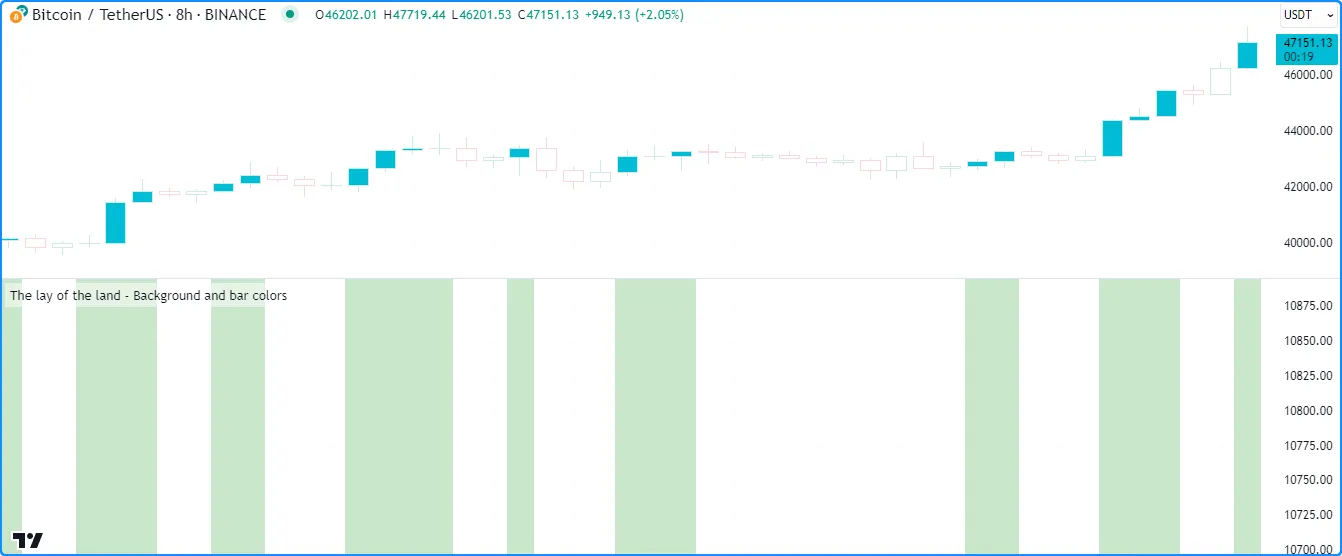
//@version=5
indicator("The lay of the land - Background and bar colors")

//@variable Is `true` if the `close` is rising over 2 bars.
bool risingPrice = ta.rising(close, 2)

// Highlight the chart background and color the main chart bars based on `risingPrice`.
bgcolor(risingPrice ? color.new(color.green, 70) : na, title= "`risingPrice` highlight")
barcolor(risingPrice ? color.aqua : chart.bg_color, title = "`risingPrice` bar color")
Pine 的 绘图类型(line、box、polyline、label)在脚本窗格中生成绘图。虽然它们不会在其他位置(例如状态行或数据窗口)返回结果,但它们提供了替代的灵活解决方案,可直接在图表上检查数值、条件和字符串:
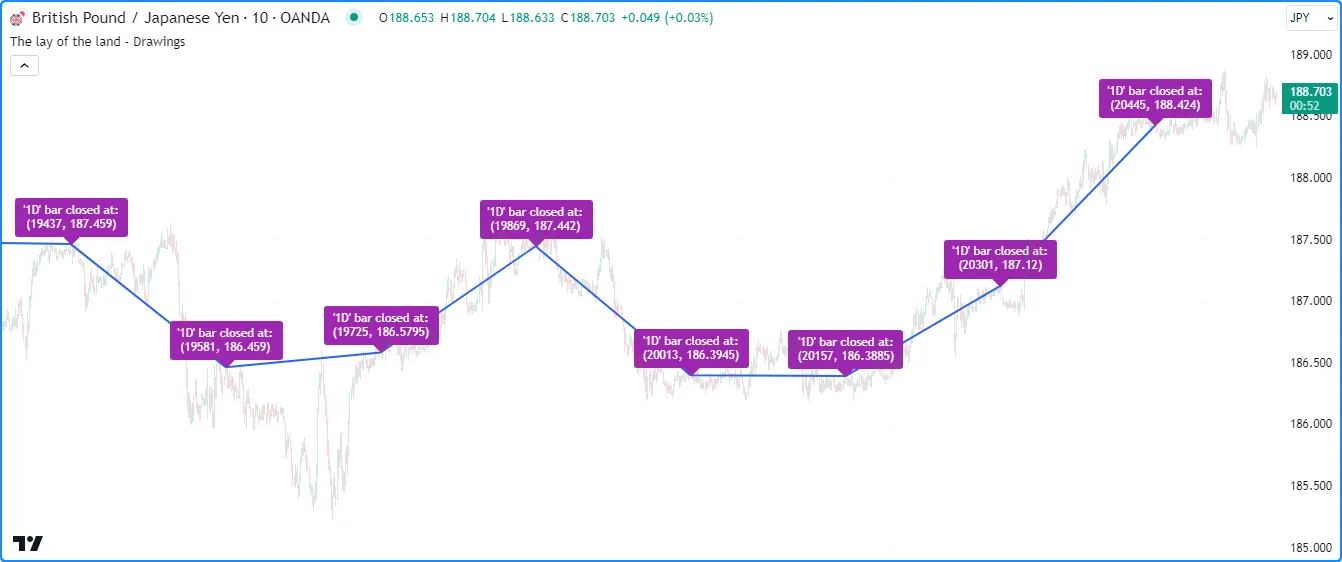
//@version=5
indicator("The lay of the land - Drawings", overlay = true)

//@variable Is `true` when the time changes on the "1D" timeframe.
bool newDailyBar = timeframe.change("1D")
//@variable The previous bar's `bar_index` from when `newDailyBar` last occurred.
int closedIndex = ta.valuewhen(newDailyBar, bar_index - 1, 0)
//@variable The previous bar's `close` from when `newDailyBar` last occurred.
float closedPrice = ta.valuewhen(newDailyBar, close[1], 0)

if newDailyBar
    //@variable Draws a line from the previous `closedIndex` and `closedPrice` to the current values.
    line debugLine = line.new(closedIndex[1], closedPrice[1], closedIndex, closedPrice, width = 2)
    //@variable Variable info to display in a label.
    string debugText = "'1D' bar closed at: \n(" + str.tostring(closedIndex) + ", " + str.tostring(closedPrice) + ")"
    //@variable Draws a label at the current `closedIndex` and `closedPrice`.
    label.new(closedIndex, closedPrice, debugText, color = color.purple, textcolor = color.white)
这些log.*()函数产生
Pine Logs
结果。每次脚本调用这些函数中的任何一个时,脚本都会在
Pine Logs窗格中记录一条消息,以及时间戳和导航选项,以识别触发日志的具体时间、图表栏和代码行:
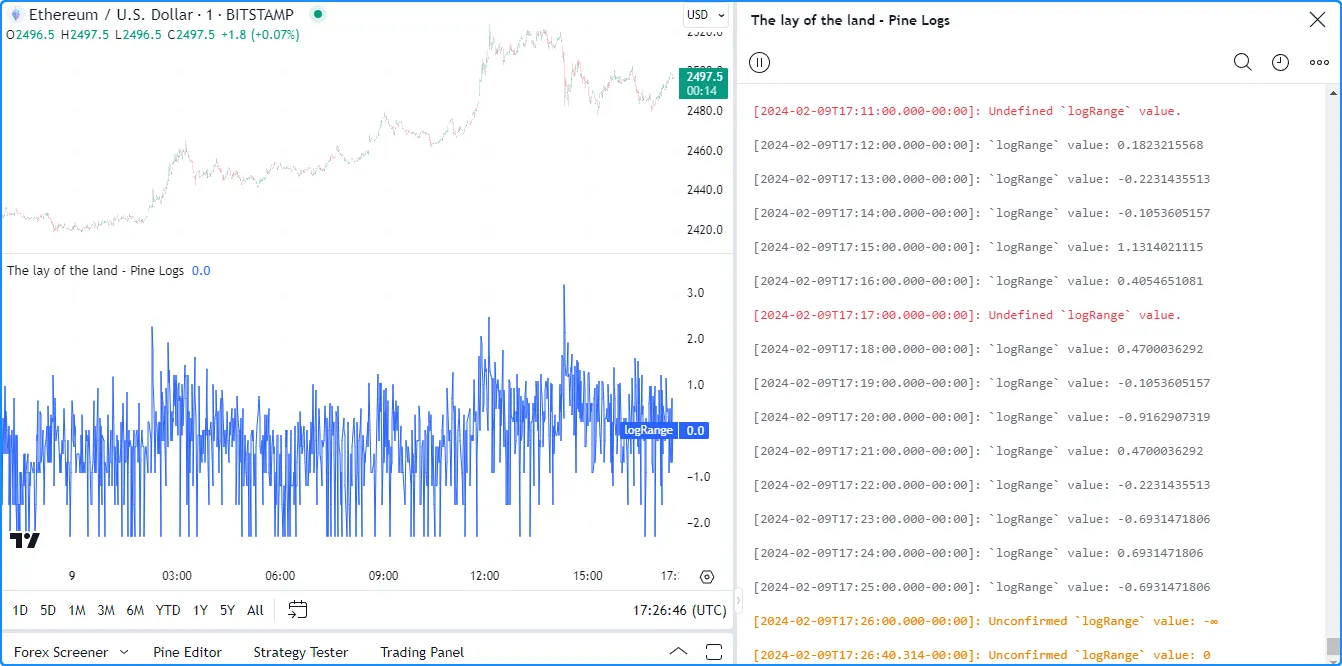
//@version=5
indicator("The lay of the land - Pine Logs")

//@variable The natural logarithm of the current `high - low` range.
float logRange = math.log(high - low)

// Plot the `logRange`.
plot(logRange, "logRange")

if barstate.isconfirmed
    // Generate an "error" or "info" message on the confirmed bar, depending on whether `logRange` is defined.
    switch
        na(logRange) => log.error("Undefined `logRange` value.")
        =>              log.info("`logRange` value: " + str.tostring(logRange))
else
    // Generate a "warning" message for unconfirmed values.
    log.warning("Unconfirmed `logRange` value: " + str.tostring(logRange))
可以应用上述任何一种或几种方法组合来建立适合其需求和偏好的调试例程,具体取决于他们处理的数据类型和结构。请参阅以下部分,详细了解各种调试技术。
数值
在 Pine Script™ 中创建代码时,不可避免地要使用数字。因此,为了确保脚本按预期工作,了解如何检查脚本接收和计算的数字( int和 float )值至关重要。
绘制数字
检查脚本数值的最直接方法之一是使用plot*()函数,它可以在图表上以图形方式显示结果,并在脚本的状态行、价格刻度和数据窗口中显示格式化的数字。函数
plot*()显示其结果的位置取决于参数display
。默认情况下,其值为
display.all。
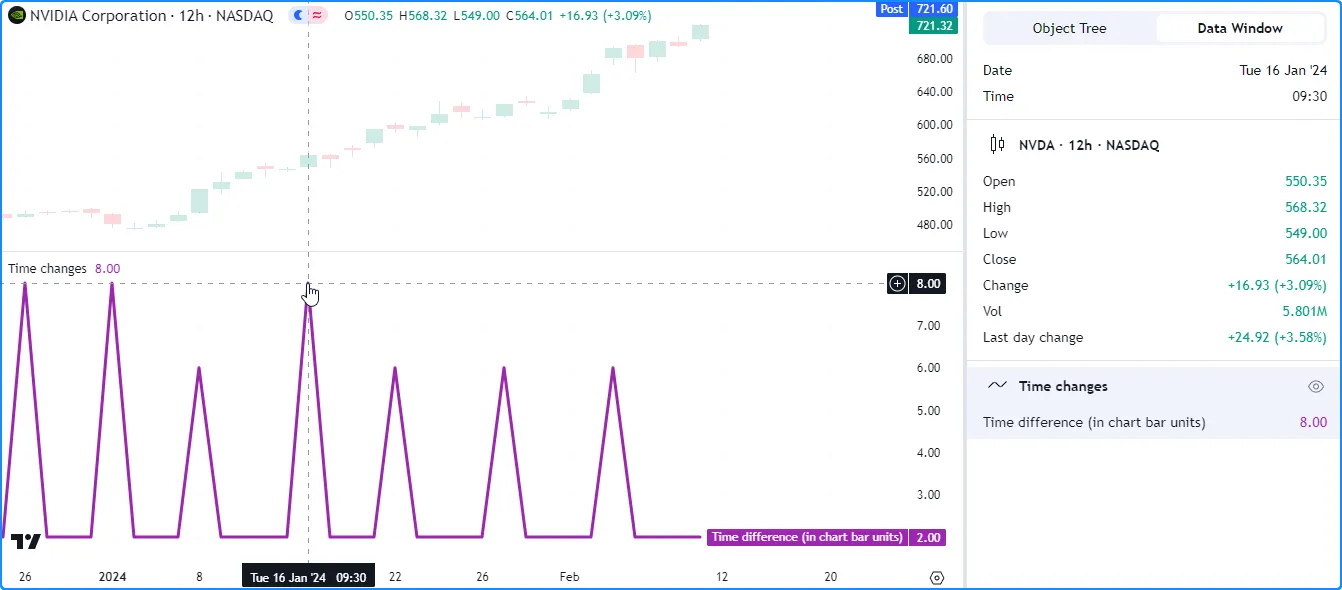
以下示例使用 plot() 函数显示以图表时间范围测量的内置 时间 变量值的 1 条变化(例如,“1D”图表上绘制的值为 1 表示当前条和前一个条的开盘时间相差一天)。检查此系列有助于识别图表数据中的时间间隔,这在设计基于时间的指标时非常有用。
由于我们没有指定display参数,该函数使用
display.all,这意味着它将在所有可能的位置显示数据,如下所示:
//@version=5
indicator("Plotting numbers demo", "Time changes")

//@variable The one-bar change in the chart symbol's `time` value, measured in units of the chart timeframe.
float timeChange = ta.change(time) / (1000.0 * timeframe.in_seconds())

// Display the `timeChange` in all possible locations.
plot(timeChange, "Time difference (in chart bar units)", color.purple, 3)
注意:
- 脚本状态行和数据窗口中显示的数字反映了图表光标位置的绘制值。当鼠标指针不在图表上时,这些区域将显示最新的条形图值。
- 价格尺度中的数字反映可见图表上的最新可用值。
在不影响规模的情况下
在脚本中调试多个数值时,程序员可能希望在不干扰价格刻度或不扰乱图表窗格中的视觉输出的情况下检查它们,因为扭曲的刻度和重叠的图表可能会使评估结果变得更加困难。
检查数字而不向图表窗格添加更多视觉效果的一种简单方法是将display脚本
plot*()调用中的值更改为使用它们的其他display.*变量或表达式。
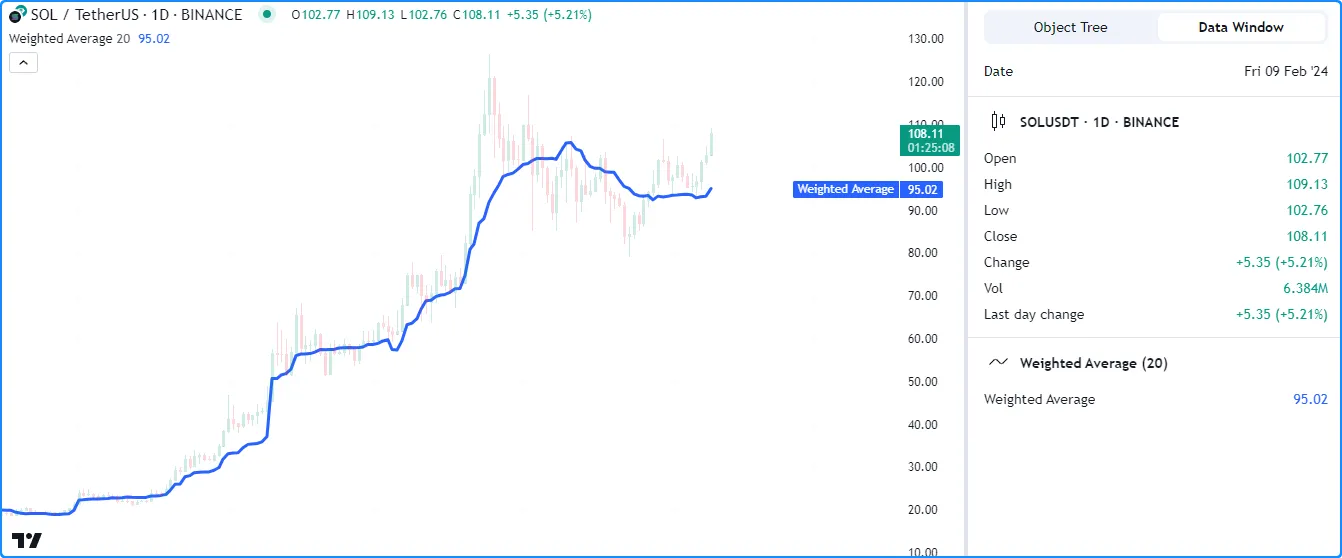
让我们看一个实际的例子。在这里,我们编写了以下脚本,通过将值的总和weight * close除以
序列
的总和来计算自定义加权移动平均值
weight:
//@version=5
indicator("Plotting without affecting the scale demo", "Weighted Average", true)

//@variable The number of bars in the average.
int lengthInput = input.int(20, "Length", 1)

//@variable The weight applied to the price on each bar.
float weight = math.pow(close - open, 2)

//@variable The numerator of the average.
float numerator = math.sum(weight * close, lengthInput)
//@variable The denominator of the average.
float denominator = math.sum(weight, lengthInput)

//@variable The `lengthInput`-bar weighted average.
float average = numerator / denominator

// Plot the `average`.
plot(average, "Weighted Average", linewidth = 3)
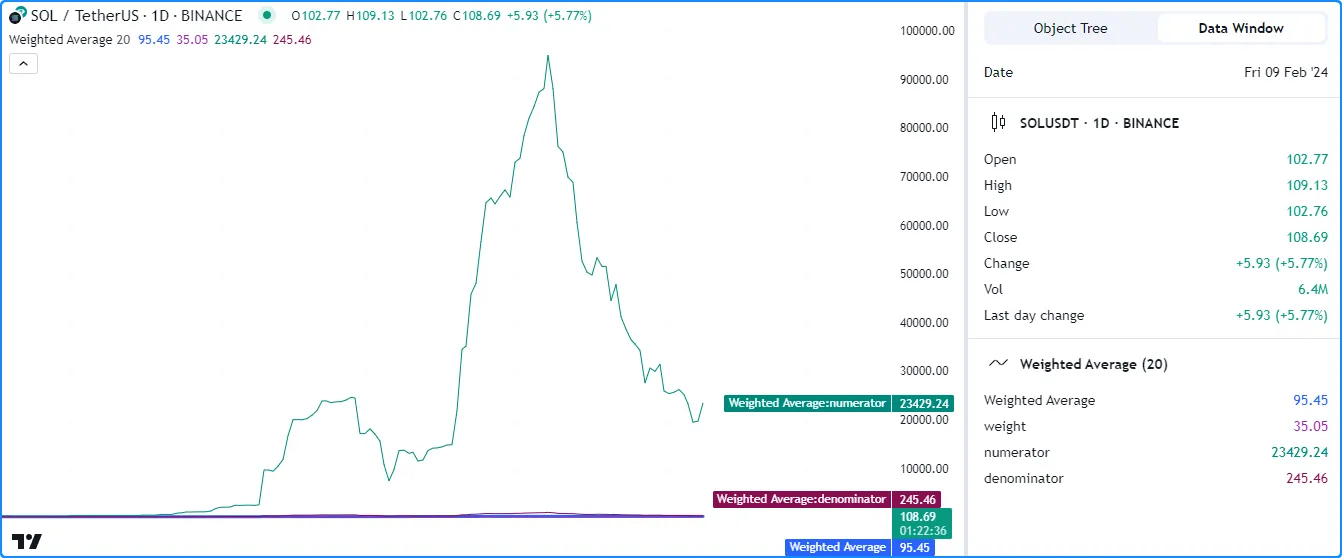
假设我们想检查计算中使用的变量average
以了解和微调结果。如果我们使用
plot()在所有位置
显示脚本的weight、numerator和denominator,我们将无法再轻松地average在图表上识别我们的线,因为每个变量都有完全不同的比例:
//@version=5
indicator("Plotting without affecting the scale demo", "Weighted Average", true)

//@variable The number of bars in the average.
int lengthInput = input.int(20, "Length", 1)

//@variable The weight applied to the price on each bar.
float weight = math.pow(close - open, 2)

//@variable The numerator of the average.
float numerator = math.sum(close * weight, lengthInput)
//@variable The denominator of the average.
float denominator = math.sum(weight, lengthInput)

//@variable The `lengthInput`-bar weighted average.
float average = numerator / denominator

// Plot the `average`.
plot(average, "Weighted Average", linewidth = 3)

// Create debug plots for the `weight`, `numerator`, and `denominator`.
plot(weight, "weight", color.purple)
plot(numerator, "numerator", color.teal)
plot(denominator, "denominator", color.maroon)
虽然我们可以从脚本设置的“样式”选项卡中隐藏单个图表,但这样做也会阻止我们在任何其他位置检查结果。为了同时查看变量的值并保留图表的比例,我们可以更改display
调试图表中的值。
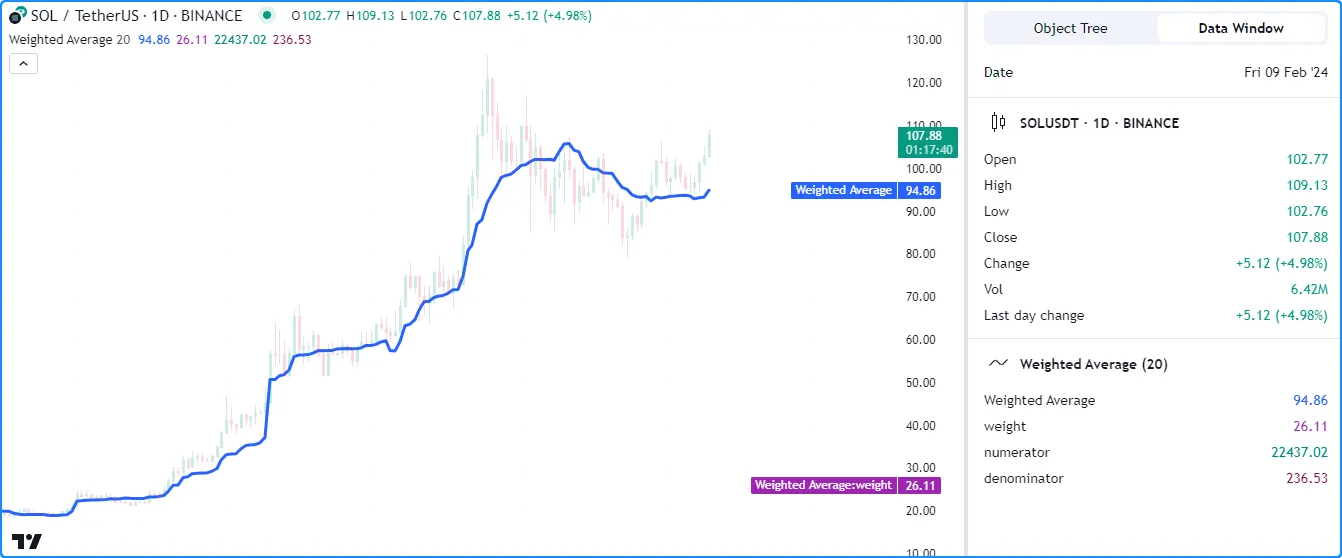
以下版本debugLocations在调试
plot()调用中包含一个变量
,其值为,display.all - display.pane用于指定除图表窗格之外的所有位置都将显示结果。现在我们可以检查计算的值,而没有额外的混乱:
//@version=5
indicator("Plotting without affecting the scale demo", "Weighted Average", true)

//@variable The number of bars in the average.
int lengthInput = input.int(20, "Length", 1)

//@variable The weight applied to the price on each bar.
float weight = math.pow(close - open, 2)

//@variable The numerator of the average.
float numerator = math.sum(close * weight, lengthInput)
//@variable The denominator of the average.
float denominator = math.sum(weight, lengthInput)

//@variable The `lengthInput`-bar weighted average.
float average = numerator / denominator

// Plot the `average`.
plot(average, "Weighted Average", linewidth = 3)

//@variable The display locations of all debug plots.
debugLocations = display.all - display.pane
// Create debug plots for the `weight`, `numerator`, and `denominator`.
plot(weight, "weight", color.purple, display = debugLocations)
plot(numerator, "numerator", color.teal, display = debugLocations)
plot(denominator, "denominator", color.maroon, display = debugLocations)
从本地范围
脚本的局部范围是条件结构、
函数和方法中的缩进代码部分
。当使用这些范围内声明的变量时,使用plot*()函数直接显示其值将不起作用,因为绘图仅适用于文字和全局变量。
要使用图表显示局部变量的值,可以将其结果分配给全局变量并将该变量传递给调用plot*()
。
例如,此脚本计算一段时间内收盘价的最大和最小变化
lengthInput。它使用
if
结构声明局部变量并每条更新一次change全局
maxChange变量:minChangelengthInput
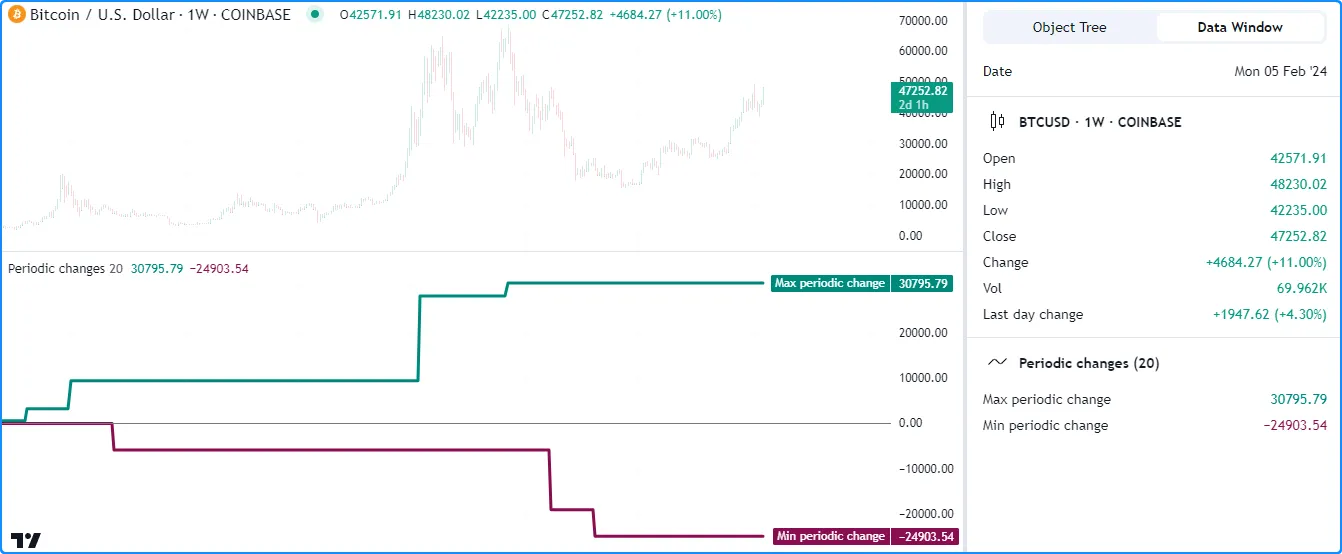
//@version=5
indicator("Plotting numbers from local scopes demo", "Periodic changes")

//@variable The number of chart bars in each period.
int lengthInput = input.int(20, "Period length", 1)

//@variable The maximum `close` change over each `lengthInput` period on the chart.
var float maxChange = na
//@variable The minimum `close` change over each `lengthInput` period on the chart.
var float minChange = na

//@variable Is `true` once every `lengthInput` bars.
bool periodClose = bar_index % lengthInput == 0

if periodClose
    //@variable The change in `close` prices over `lengthInput` bars.
    float change = close - close[lengthInput]
    // Update the global `maxChange` and `minChange`.
    maxChange := math.max(nz(maxChange, change), change)
    minChange := math.min(nz(minChange, change), change)

// Plot the `maxChange` and `minChange`.
plot(maxChange, "Max periodic change", color.teal, 3)
plot(minChange, "Min periodic change", color.maroon, 3)
hline(0.0, color = color.gray, linestyle = hline.style_solid)
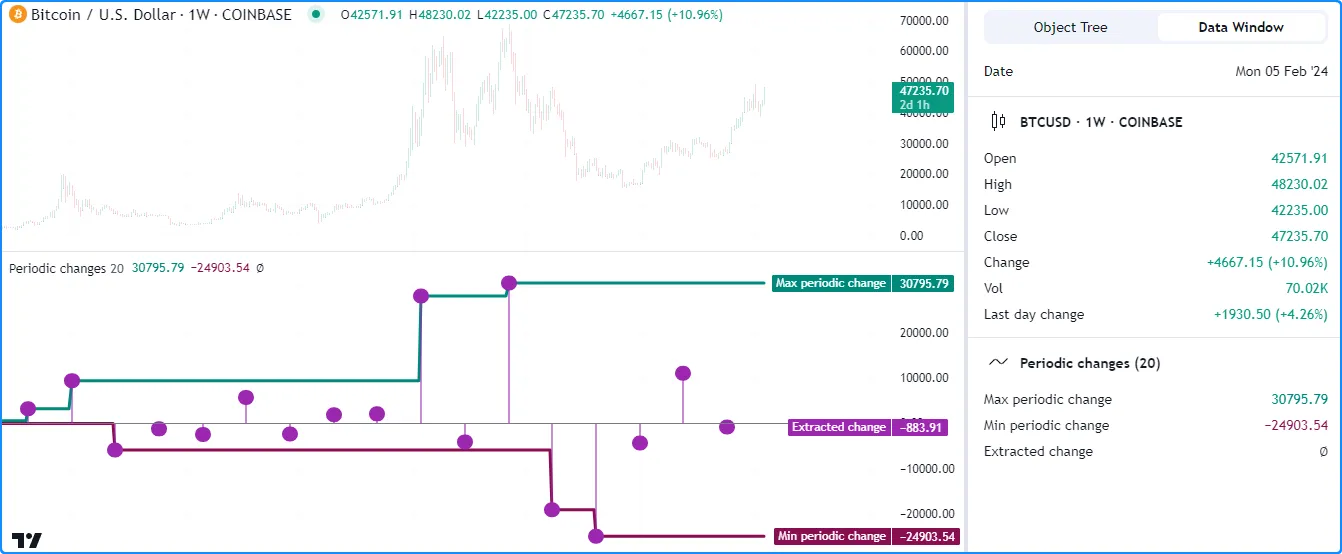
假设我们想change使用绘图检查变量的历史记录。虽然我们无法直接绘制变量,因为脚本在本地范围内声明了它,但我们可以将其值分配给另一个
全局变量以供函数使用plot*()。
下面,我们在全局范围内添加了一个debugChange初始值为
na的变量,脚本
使用局部变量在ifchange结构中重新分配其值。现在,我们可以将
plot()
与变量一起使用来查看可用值debugChange的历史记录
:change
//@version=5
indicator("Plotting numbers from local scopes demo", "Periodic changes")

//@variable The number of chart bars in each period.
int lengthInput = input.int(20, "Period length", 1)

//@variable The maximum `close` change over each `lengthInput` period on the chart.
var float maxChange = na
//@variable The minimum `close` change over each `lengthInput` period on the chart.
var float minChange = na

//@variable Is `true` once every `lengthInput` bars.
bool periodClose = bar_index % lengthInput == 0

//@variable Tracks the history of the local `change` variable.
float debugChange = na

if periodClose
    //@variable The change in `close` prices over `lengthInput` bars.
    float change = close - close[lengthInput]
    // Update the global `maxChange` and `minChange`.
    maxChange := math.max(nz(maxChange, change), change)
    minChange := math.min(nz(minChange, change), change)
    // Assign the `change` value to the `debugChange` variable.
    debugChange := change

// Plot the `maxChange` and `minChange`.
plot(maxChange, "Max periodic change", color.teal, 3)
plot(minChange, "Min periodic change", color.maroon, 3)
hline(0.0, color = color.gray, linestyle = hline.style_solid)

// Create a debug plot to visualize the `change` history.
plot(debugChange, "Extracted change", color.purple, 15, plot.style_areabr)
注意:
- 该脚本在调试图中使用了 plot.style_areabr ,它 不像默认样式那样 跨 na值。
- 当最右侧可见条形图的绘制值为 na时 ,价格尺度中的数字代表该条形图之前的最新非 na 值(如果存在)。
附有图纸
以图形方式检查脚本数值历史记录的另一种方法是使用 Pine 的 绘图类型,包括 线条、 框、 折线和标签。
虽然 Pine 绘图不会在图表窗格以外的任何地方显示结果,但脚本可以在本地范围内创建它们,包括函数和 方法的范围 (请参阅 调试函数部分以了解更多信息)。此外,脚本可以将绘图定位在任何可用的图表位置,而不管当前的 bar_index如何。
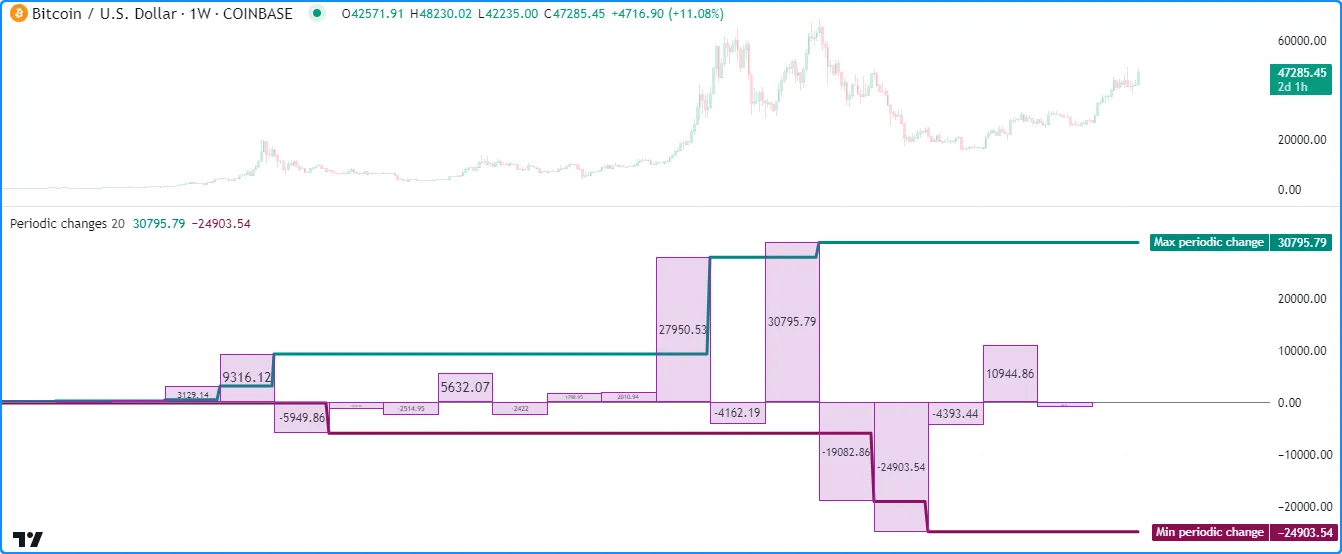
例如,让我们重新回顾
上一节中的“定期更改”脚本。假设我们想
在不change使用绘图的情况下检查局部变量的历史记录。在这种情况下,我们可以避免声明单独的全局变量,而是直接从if结构的局部范围创建绘图对象
。
下面的脚本是前一个脚本的修改版,它使用
方框来可视化变量的行为。在ifchange结构的范围内
,它调用
box.new()
来创建一个
从之前的 bar 到当前
bar_index 的方框:lengthInput
//@version=5
indicator("Drawing numbers from local scopes demo", "Periodic changes", max_boxes_count = 500)

//@variable The number of chart bars in each period.
int lengthInput = input.int(20, "Period length", 1)

//@variable The maximum `close` change over each `lengthInput` period on the chart.
var float maxChange = na
//@variable The minimum `close` change over each `lengthInput` period on the chart.
var float minChange = na

//@variable Is `true` once every `lengthInput` bars.
bool periodClose = bar_index % lengthInput == 0

if periodClose
    //@variable The change in `close` prices over `lengthInput` bars.
    float change = close - close[lengthInput]
    // Update the global `maxChange` and `minChange`.
    maxChange := math.max(nz(maxChange, change), change)
    minChange := math.min(nz(minChange, change), change)
    //@variable Draws a box on the chart to visualize the `change` value.
    box debugBox = box.new(
         bar_index - lengthInput, math.max(change, 0.0), bar_index, math.min(change, 0.0),
         color.purple, bgcolor = color.new(color.purple, 80), text = str.tostring(change)
     )

// Plot the `maxChange` and `minChange`.
plot(maxChange, "Max periodic change", color.teal, 3)
plot(minChange, "Min periodic change", color.maroon, 3)
hline(0.0, color = color.gray, linestyle = hline.style_solid)
注意:
- 该脚本包含
max_boxes_count = 500indicator ()函数,允许其 在图表上 显示最多 500 个 框。 - 我们
在
box.new()函数中使用math.max(change, 0.0)
和math.min(change, 0.0)
作为和值。
topbottom - box.new
()
调用包含
str.tostring(change)
作为其参数,以在每个方框图
text中显示变量“浮点”值 的“字符串”表示形式 。请参阅 下面字符串部分的 这一部分 ,了解有关使用字符串表示数据的更多信息。change
有关使用 框和其他相关 绘图类型的更多信息,请参阅我们的用户手册的 线条和框 页面。
状况
在 Pine 中创建的许多脚本都涉及声明和评估 条件以指示特定的脚本操作,例如触发不同的计算模式、视觉效果、信号、警报、策略订单等。因此,必须了解如何检查脚本使用的条件以确保正确执行。
作为数字
调试脚本条件的一种可能方法是基于它们定义数值,这允许程序员使用数字方法来检查它们,例如 上一节中概述的方法。
让我们看一个简单的例子。此脚本计算ohlc4
价格与lengthInput-bar移动平均线之间的比率
。它为变量分配一个条件,
只要比率值超过 1(即价格高于平均值),priceAbove该变量就会返回。true
为了检查条件的发生情况,我们创建了一个debugValue
变量,该变量分配给一个表达式的结果,该表达式使用三元
?:priceAbove运算符,当为
时返回 1 true,否则返回 0。该脚本在所有可用位置绘制变量的值:
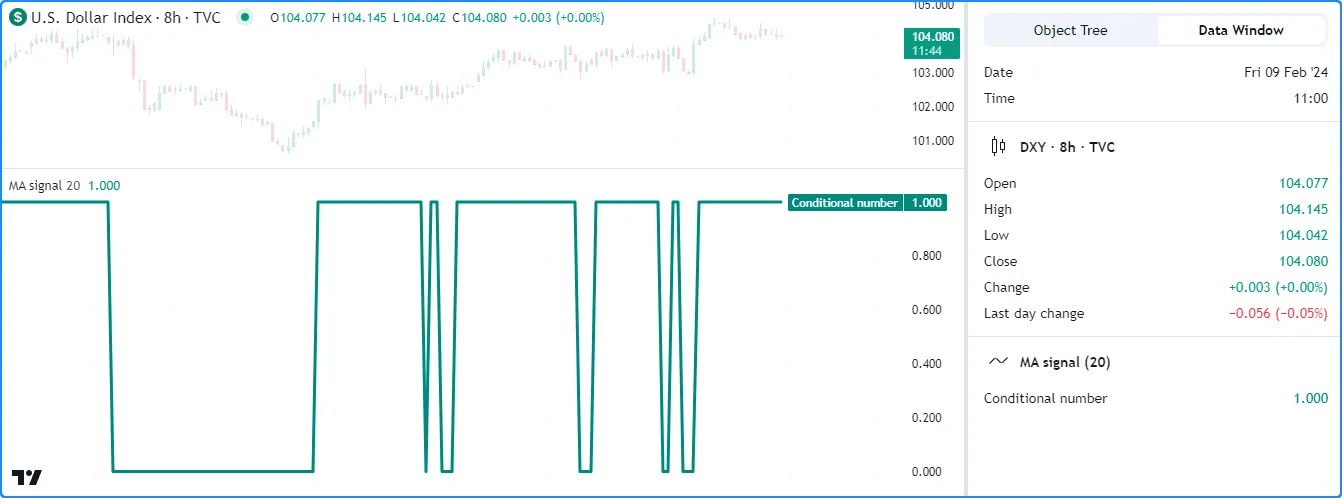
//@version=5
indicator("Conditions as numbers demo", "MA signal")

//@variable The number of bars in the moving average calculation.
int lengthInput = input.int(20, "Length", 1)

//@variable The ratio of the `ohlc4` price to its `lengthInput`-bar moving average.
float ratio = ohlc4 / ta.sma(ohlc4, lengthInput)

//@variable The condition to inspect. Is `true` when `ohlc4` is above its moving average, `false` otherwise.
bool priceAbove = ratio > 1.0
//@variable Returns 1 when the `priceAbove` condition is `true`, 0 otherwise.
int debugValue = priceAbove ? 1 : 0

// Plot the `debugValue.
plot(debugValue, "Conditional number", color.teal, 3)
注意:
- 使用数字表示“bool”值还允许脚本使用plotshape() 和 plotchar()在特定 y 轴位置显示条件形状或字符 ,并且它有助于使用 plotarrow()进行条件调试。请参阅 下一节以了解更多信息。
绘制条件形状
plotshape
()
和
plotchar()
函数为调试条件提供了实用性,因为它们可以在包含true或非 naseries参数时在绝对或相对图表位置绘制形状或字符。
这些函数还可以在脚本的状态行和数据窗口中显示数值表示
series,这意味着它们对于调试
数字也很有帮助。我们在“提示”部分展示了使用这些函数调试数字的简单实用的方法。
图表的图表位置取决于参数location,默认情况下为
location.abovebar
。
让我们使用这些函数检查一个条件。以下脚本计算具有
长度和变量的RSI ,该变量的值是当 RSI 低于 30 时
返回的条件的结果。每次发生条件时,它都会调用plotshape()
在窗格顶部附近显示一个圆圈:lengthInputcrossBelowtrue
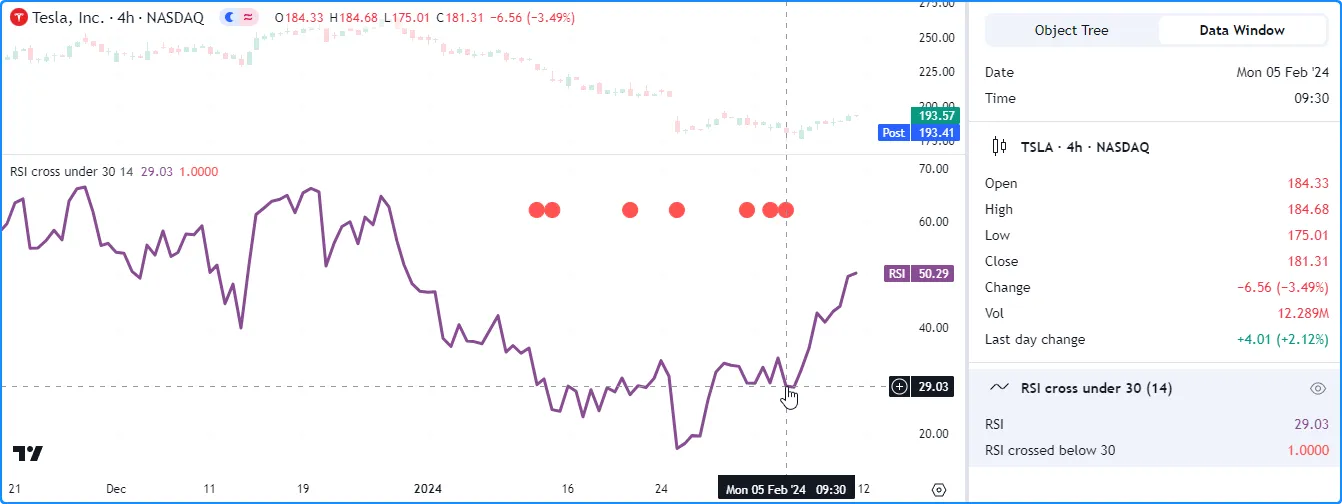
//@version=5
indicator("Conditional shapes demo", "RSI cross under 30")

//@variable The length of the RSI.
int lengthInput = input.int(14, "Length", 1)

//@variable The calculated RSI value.
float rsi = ta.rsi(close, lengthInput)

//@variable Is `true` when the `rsi` crosses below 30, `false` otherwise.
bool crossBelow = ta.crossunder(rsi, 30.0)

// Plot the `rsi`.
plot(rsi, "RSI", color.rgb(136, 76, 146), linewidth = 3)
// Plot the `crossBelow` condition as circles near the top of the pane.
plotshape(crossBelow, "RSI crossed below 30", shape.circle, location.top, color.red, size = size.small)
注意:
- 当 时,状态行和数据窗口显示值 1
,
crossBelow当true时,显示值 0false。
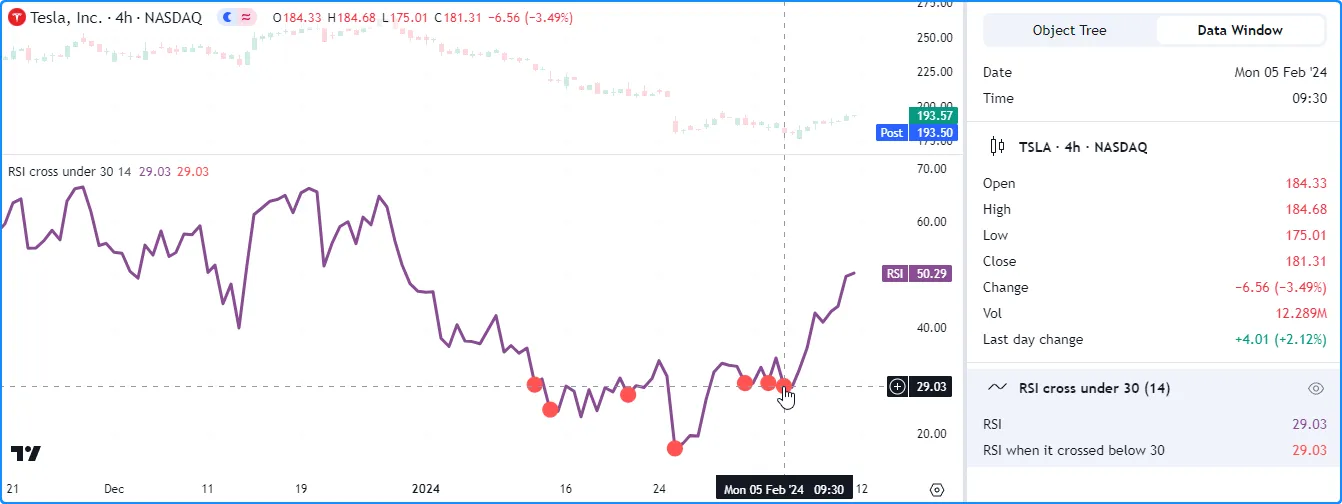
假设我们想在精确位置而不是相对于图表窗格显示形状。我们可以通过 在 plotshape()调用中使用条件数字和 location.absolute来实现这一点 。
在此示例中,我们修改了上一个脚本,创建了一个
变量,当is
时debugNumber返回值,
否则
返回 na。plotshape ()
函数使用这个新变量作为其参数,并
使用 location.absolute
作为其参数:rsicrossBelowtrueserieslocation
//@version=5
indicator("Conditional shapes demo", "RSI cross under 30")

//@variable The length of the RSI.
int lengthInput = input.int(14, "Length", 1)

//@variable The calculated RSI value.
float rsi = ta.rsi(close, lengthInput)

//@variable Is `true` when the `rsi` crosses below 30, `false` otherwise.
bool crossBelow = ta.crossunder(rsi, 30.0)
//@variable Returns the `rsi` when `crossBelow` is `true`, `na` otherwise.
float debugNumber = crossBelow ? rsi : na

// Plot the `rsi`.
plot(rsi, "RSI", color.rgb(136, 76, 146), linewidth = 3)
// Plot circles at the `debugNumber`.
plotshape(debugNumber, "RSI when it crossed below 30", shape.circle, location.absolute, color.red, size = size.small)
注意:
- 由于我们将数字
debugNumber系列传递给函数,我们的条件图现在显示状态行和数据窗口中的值,而不是 1 或 0。
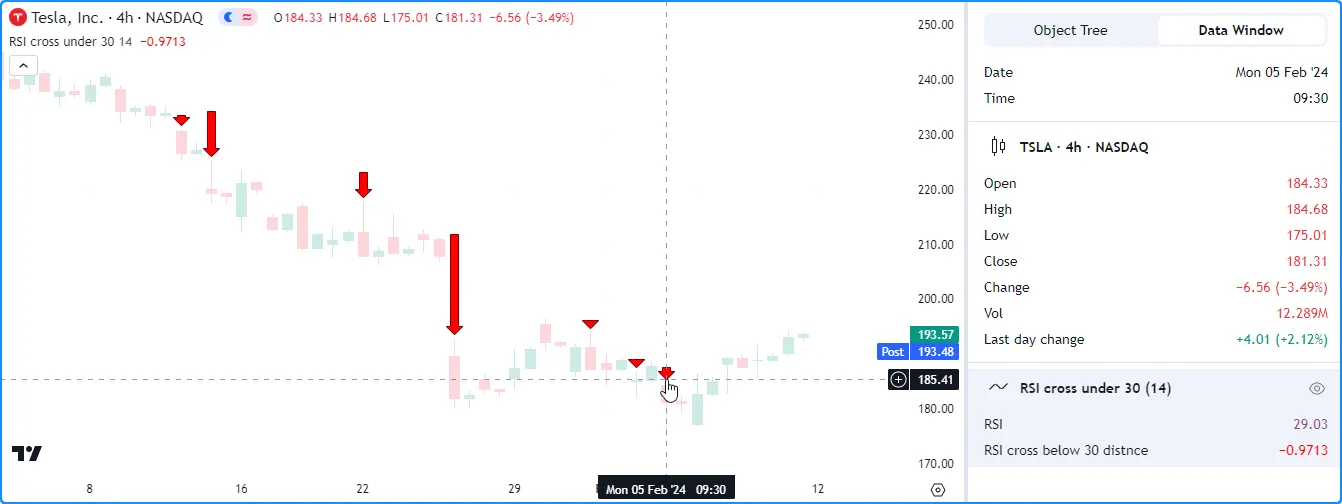
调试条件的另一种便捷方法是使用
plotarrow()。当参数非零且不为
na时,此函数会绘制一个相对于主图表价格位置的箭头。每个箭头的长度随提供的值而变化。与
plotshape()
和
plotchar()一样,
plotarrow()
也可以在状态行和数据窗口中显示数值结果。seriesseries
crossBelow
此示例展示了使用
plotarrow()检查条件的另一种方法。在此版本中,我们在
indicator()overlay函数中设置为
,并添加了
plotarrow()
调用以可视化条件值。此示例中的测量每次条件发生时低于 30 的程度:truedebugNumberrsi
//@version=5
indicator("Conditional shapes demo", "RSI cross under 30", true)

//@variable The length of the RSI.
int lengthInput = input.int(14, "Length", 1)

//@variable The calculated RSI value.
float rsi = ta.rsi(close, lengthInput)

//@variable Is `true` when the `rsi` crosses below 30, `false` otherwise.
bool crossBelow = ta.crossunder(rsi, 30.0)
//@variable Returns `rsi - 30.0` when `crossBelow` is `true`, `na` otherwise.
float debugNumber = crossBelow ? rsi - 30.0 : na

// Plot the `rsi`.
plot(rsi, "RSI", color.rgb(136, 76, 146), display = display.data_window)
// Plot circles at the `debugNumber`.
plotarrow(debugNumber, "RSI cross below 30 distnce")
注意:
- 我们将display.data_window的
plot ()
display中的值 设置 为 保留图表的比例。rsi
要了解有关 plotshape()、 plotchar()和 plotarrow()的更多信息,请参阅本手册的 文本和形状 页面。
条件颜色
在 Pine 中以直观方式表示条件的一种优雅方式是创建
基于或状态返回颜色值的表达式,因为脚本可以使用它们来控制绘图对象的外观
或、
fill()、
bgcolor()或
barcolor()调用的结果
。truefalseplot*()
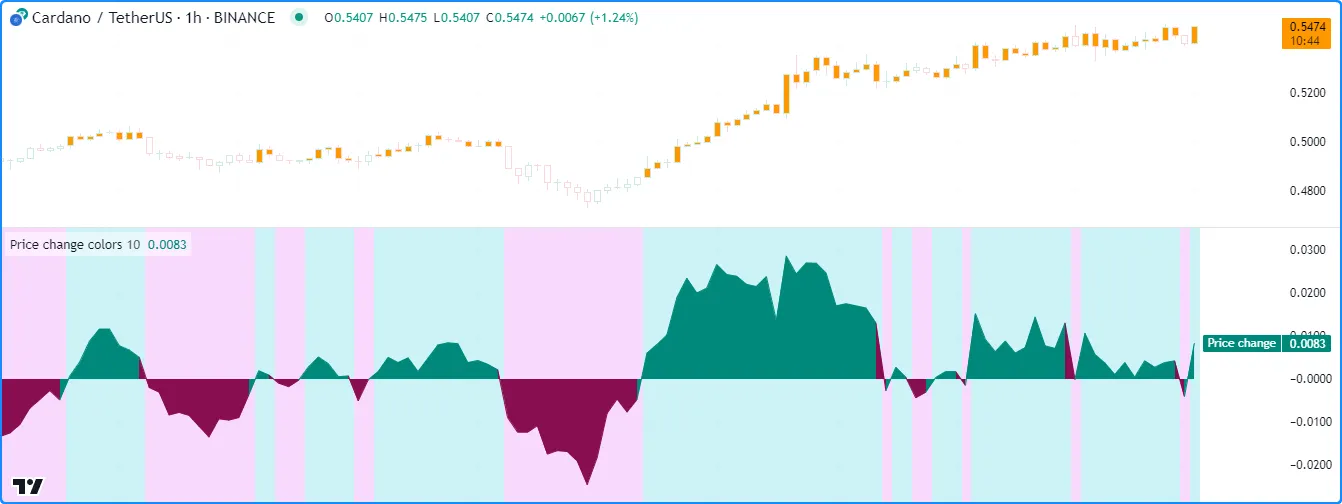
例如,该脚本计算
收盘
价随lengthInput条形图的变化,并声明两个“bool”变量来识别价格变化是正还是负。
该脚本使用这些“bool”值作为
三元
表达式中的条件来分配三个“color”变量的值,然后使用这些变量作为plot()、
bgcolor()和
barcolor()color中的参数
来调试结果:
//@version=5
indicator("Conditional colors demo", "Price change colors")

//@variable The number of bars in the price change calculation.
int lengthInput = input.int(10, "Length", 1)

//@variable The change in `close` prices over `lengthInput` bars.
float priceChange = ta.change(close, lengthInput)

//@variable Is `true` when the `priceChange` is a positive value, `false` otherwise.
bool isPositive = priceChange > 0
//@variable Is `true` when the `priceChange` is a negative value, `false` otherwise.
bool isNegative = priceChange < 0

//@variable Returns a color for the `priceChange` plot to show when `isPositive`, `isNegative`, or neither occurs.
color plotColor = isPositive ? color.teal : isNegative ? color.maroon : chart.fg_color
//@variable Returns an 80% transparent color for the background when `isPositive` or `isNegative`, `na` otherwise.
color bgColor = isPositive ? color.new(color.aqua, 80) : isNegative ? color.new(color.fuchsia, 80) : na
//@variable Returns a color to emphasize chart bars when `isPositive` occurs. Otherwise, returns the `chart.bg_color`.
color barColor = isPositive ? color.orange : chart.bg_color

// Plot the `priceChange` and color it with the `plotColor`.
plot(priceChange, "Price change", plotColor, style = plot.style_area)
// Highlight the pane's background with the `bgColor`.
bgcolor(bgColor, title = "Background highlight")
// Emphasize the chart bars with positive price change using the `barColor`.
barcolor(barColor, title = "Positive change bars")
注意:
- barcolor () 函数始终为主图表的条形图着色,无论脚本是否占用另一个图表窗格,并且仅当条形图可见时图表才会显示结果。
有关使用颜色、 填充图、 突出显示背景和 着色条的更多信息,请参阅颜色、填充、背景和条形着色页面。
使用图纸
Pine Script™ 的 绘图类型提供了灵活的方式来可视化图表上的条件,尤其是当条件在本地范围内时。
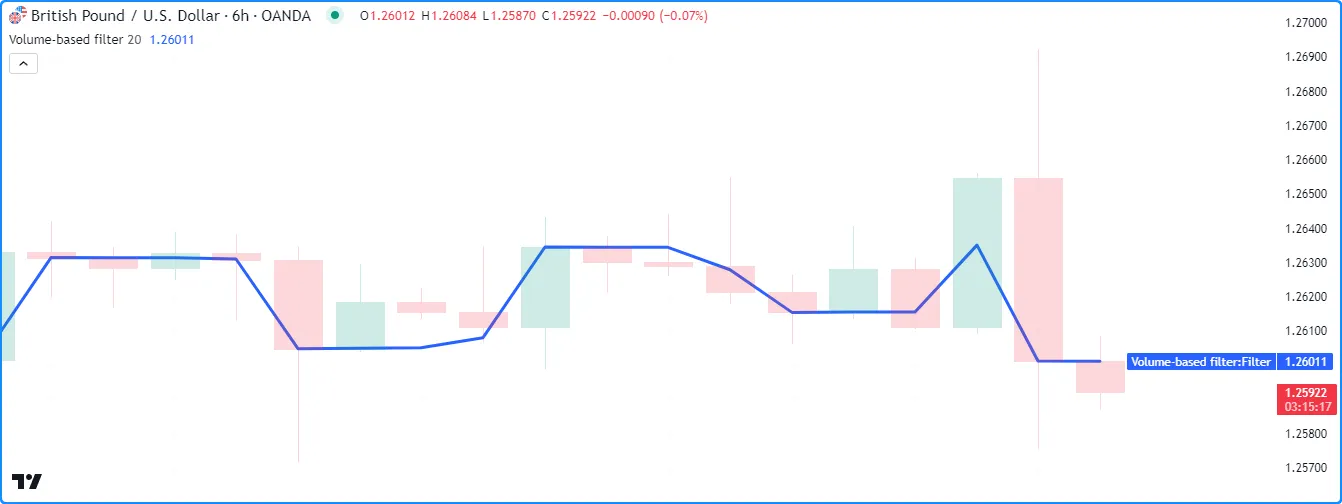
考虑以下脚本,该脚本filter使用平滑参数( )计算自定义,该参数会
根据最近的
成交量条件在ifalpha结构中改变其值
:
//@version=5
indicator("Conditional drawings demo", "Volume-based filter", true)

//@variable The number of bars in the volume average.
int lengthInput = input.int(20, "Volume average length", 1)

//@variable The average `volume` over `lengthInput` bars.
float avgVolume = ta.sma(volume, lengthInput)

//@variable A custom price filter based on volume activity.
float filter = close
//@variable The smoothing parameter of the filter calculation. Its value depends on multiple volume conditions.
float alpha = na

// Set the `alpha` to 1 if `volume` exceeds its `lengthInput`-bar moving average.
if volume > avgVolume
    alpha := 1.0
// Set the `alpha` to 0.5 if `volume` exceeds its previous value.
else if volume > volume[1]
    alpha := 0.5
// Set the `alpha` to 0.01 otherwise.
else
    alpha := 0.01

// Calculate the new `filter` value.
filter := (1.0 - alpha) * nz(filter[1], filter) + alpha * close

// Plot the `filter`.
plot(filter, "Filter", linewidth = 3)
假设我们想检查控制alpha
值的条件。我们可以通过多种方式使用图表视觉效果来完成任务。但是,有些方法需要更多代码和谨慎处理。
例如,为了
使用绘制的形状或
背景颜色来可视化if
结构的条件
,我们必须在全局范围内创建额外的变量或表达式,以供或
bgcolor()
函数访问。plot*()
或者,我们可以使用 绘图类型来简洁地可视化条件,而无需那些额外的步骤。
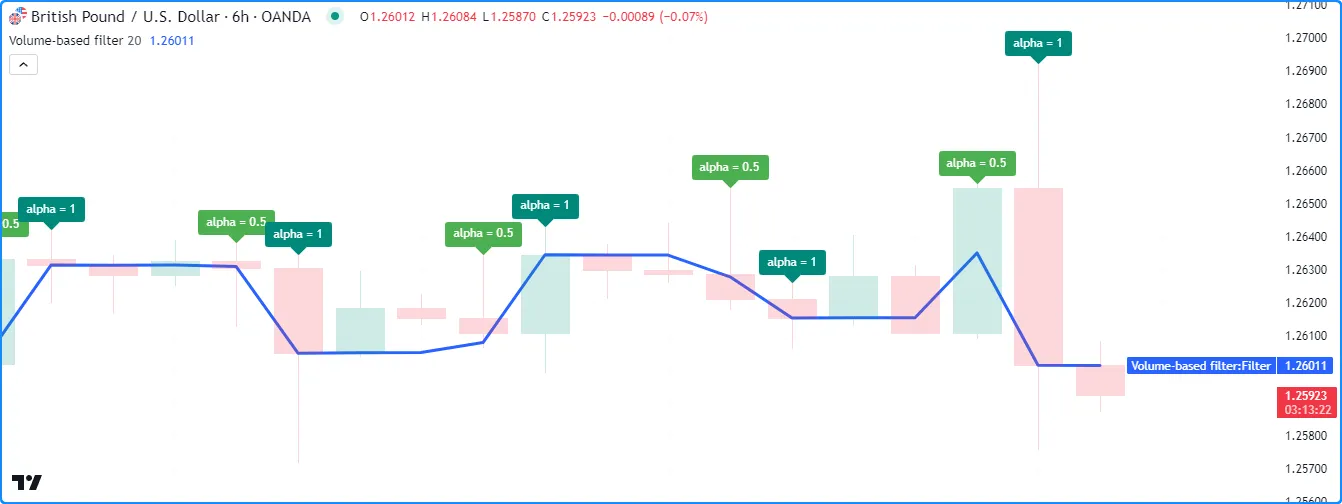
以下是对上一个脚本的修改,该脚本 在条件结构 的特定分支中 调用label.new(),以便在执行这些分支时在图表上绘制 标签。这些简单的更改使我们能够在图表上识别这些条件,而无需太多额外的代码:
//@version=5
indicator("Conditional drawings demo", "Volume-based filter", true, max_labels_count = 500)

//@variable The number of bars in the volume average.
int lengthInput = input.int(20, "Volume average length", 1)

//@variable The average `volume` over `lengthInput` bars.
float avgVolume = ta.sma(volume, lengthInput)

//@variable A custom price filter based on volume activity.
float filter = close
//@variable The smoothing parameter of the filter calculation. Its value depends on multiple volume conditions.
float alpha = na

// Set the `alpha` to 1 if `volume` exceeds its `lengthInput`-bar moving average.
if volume > avgVolume
    // Add debug label.
    label.new(chart.point.now(high), "alpha = 1", color = color.teal, textcolor = color.white)
    alpha := 1.0
// Set the `alpha` to 0.5 if `volume` exceeds its previous value.
else if volume > volume[1]
    // Add debug label.
    label.new(chart.point.now(high), "alpha = 0.5", color = color.green, textcolor = color.white)
    alpha := 0.5
// Set the `alpha` to 0.01 otherwise.
else
    alpha := 0.01

// Calculate the new `filter` value.
filter := (1.0 - alpha) * nz(filter[1], filter) + alpha * close

// Plot the `filter`.
plot(filter, "Filter", linewidth = 3)
注意:
- 我们在重新赋值表达式上方添加了
label.new ( )
调用,因为if结构中每个分支的返回类型
必须匹配。
alpha - indicator
()
函数包括
max_labels_count = 500指定脚本可以 在图表上显示最多 500 个标签。
复合条件和嵌套条件
当程序员需要识别可能发生多种条件的情况时,他们可以通过用逻辑运算符(与、 或)聚合各个条件来构建复合条件。
例如,这行代码显示仅当发生或时才返回
compoundCondition的变量:truecondition1condition2condition3
bool compoundCondition = condition1 and (condition2 or condition3)
也可以使用
条件结构或三元表达式创建嵌套条件。例如,
如果
发生且或,则此if
结构将分配给变量。但是,与上面的逻辑表达式不同,此结构的分支还允许脚本在分配“bool”值之前执行其他代码:truenestedConditioncondition1condition2condition3
bool nestedCondition = false

if condition1
    // [additional_code]
    if condition2
        // [additional_code]
        nestedCondition := true
    else if condition3
        // [additional_code]
        nestedCondition := true
无论哪种情况,无论是使用代码中的复合条件还是嵌套条件,都可以通过验证组成它们的各个条件的行为来省去很多麻烦并确保它们按预期工作。
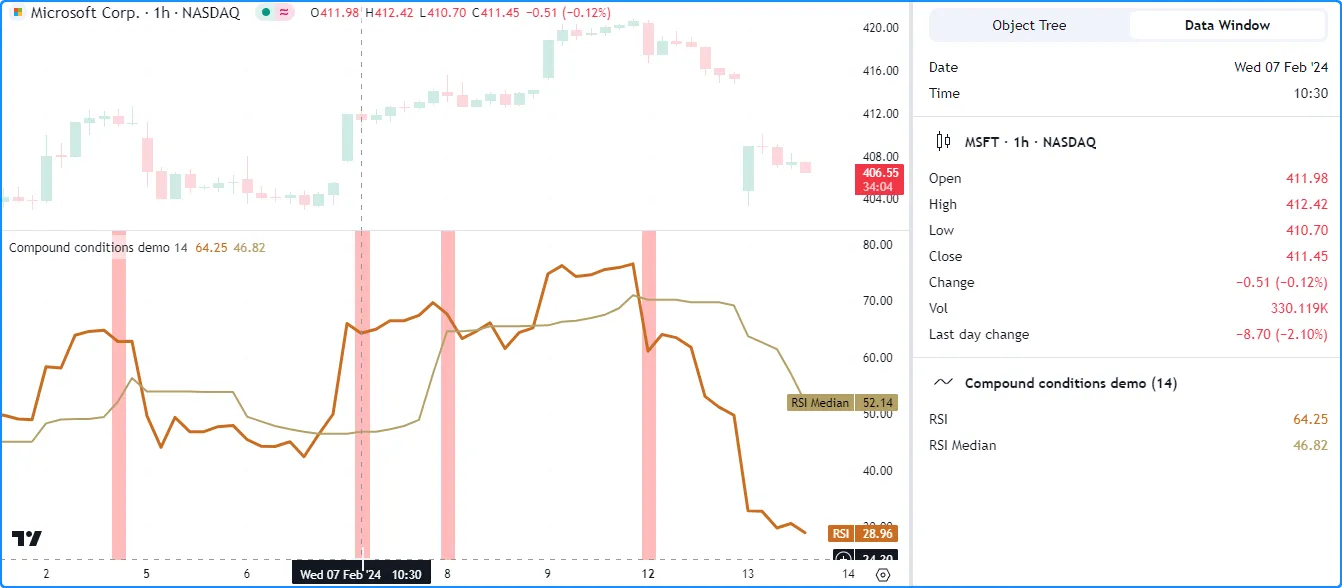
例如,此脚本计算了上划线的
rsi和。然后,它创建了五个变量来表示不同的奇异条件。该脚本在逻辑表达式中使用这些变量为变量分配一个“bool”值
,并使用
条件背景颜色显示结果
:medianrsilengthInputcompoundConditioncompoundCondition
//@version=5
indicator("Compound conditions demo")

//@variable The length of the RSI and median RSI calculations.
int lengthInput = input.int(14, "Length", 2)

//@variable The `lengthInput`-bar RSI.
float rsi = ta.rsi(close, lengthInput)
//@variable The `lengthInput`-bar median of the `rsi`.
float median = ta.median(rsi, lengthInput)

//@variable Condition #1: Is `true` when the 1-bar `rsi` change switches from 1 to -1.
bool changeNegative = ta.change(math.sign(ta.change(rsi))) == -2
//@variable Condition #2: Is `true` when the previous bar's `rsi` is greater than 70.
bool prevAbove70 = rsi[1] > 70.0
//@variable Condition #3: Is `true` when the current `close` is lower than the previous bar's `open`.
bool closeBelow = close < open[1]
//@variable Condition #4: Is `true` when the `rsi` is between 60 and 70.
bool betweenLevels = bool(math.max(70.0 - rsi, 0.0) * math.max(rsi - 60.0, 0.0))
//@variable Condition #5: Is `true` when the `rsi` is above the `median`.
bool aboveMedian = rsi > median

//@variable Is `true` when the first condition occurs alongside conditions 2 and 3 or 4 and 5.
bool compundCondition = changeNegative and ((prevAbove70 and closeBelow) or (betweenLevels and aboveMedian))

//Plot the `rsi` and the `median`.
plot(rsi, "RSI", color.rgb(201, 109, 34), 3)
plot(median, "RSI Median", color.rgb(180, 160, 102), 2)

// Highlight the background red when the `compundCondition` occurs.
bgcolor(compundCondition ? color.new(color.red, 60) : na, title = "compundCondition")
正如我们上面所看到的,仅通过可视化其最终结果并不一定容易理解其行为compoundCondition,因为五个底层奇异条件决定了最终值。为了有效地调试compoundCondition本例中的,我们还必须检查组成它的条件。
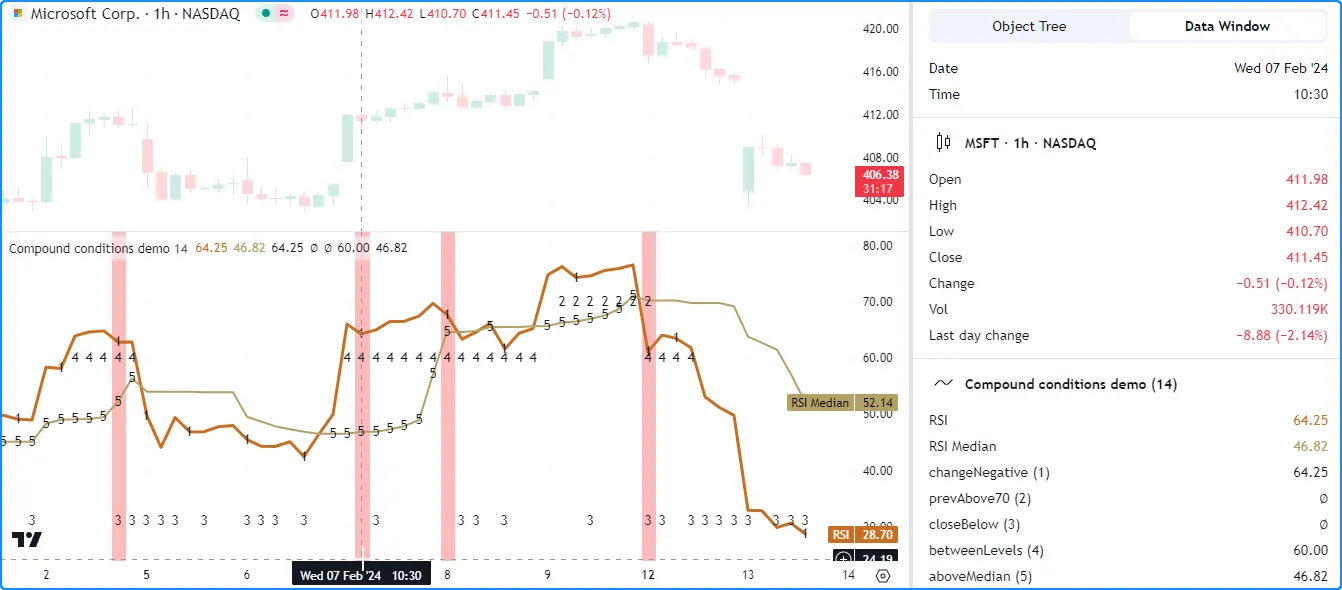
在下面的示例中,我们添加了五个
plotchar()
调用,以便在发生每种单一情况时在图表上显示
字符并在状态行和数据窗口中显示数值。检查每个结果为我们提供了有关 行为的更完整信息
compoundCondition:
//@version=5
indicator("Compound conditions demo")

//@variable The length of the RSI and median RSI calculations.
int lengthInput = input.int(14, "Length", 2)

//@variable The `lengthInput`-bar RSI.
float rsi = ta.rsi(close, lengthInput)
//@variable The `lengthInput`-bar median of the `rsi`.
float median = ta.median(rsi, lengthInput)

//@variable Condition #1: Is `true` when the 1-bar `rsi` change switches from 1 to -1.
bool changeNegative = ta.change(math.sign(ta.change(rsi))) == -2
//@variable Condition #2: Is `true` when the previous bar's `rsi` is greater than 70.
bool prevAbove70 = rsi[1] > 70.0
//@variable Condition #3: Is `true` when the current `close` is lower than the previous bar's `open`.
bool closeBelow = close < open[1]
//@variable Condition #4: Is `true` when the `rsi` is between 60 and 70.
bool betweenLevels = bool(math.max(70.0 - rsi, 0.0) * math.max(rsi - 60.0, 0.0))
//@variable Condition #5: Is `true` when the `rsi` is above the `median`.
bool aboveMedian = rsi > median

//@variable Is `true` when the first condition occurs alongside conditions 2 and 3 or 4 and 5.
bool compundCondition = changeNegative and ((prevAbove70 and closeBelow) or (betweenLevels and aboveMedian))

//Plot the `rsi` and the `median`.
plot(rsi, "RSI", color.rgb(201, 109, 34), 3)
plot(median, "RSI Median", color.rgb(180, 160, 102), 2)

// Highlight the background red when the `compundCondition` occurs.
bgcolor(compundCondition ? color.new(color.red, 60) : na, title = "compundCondition")

// Plot characters on the chart when conditions 1-5 occur.
plotchar(changeNegative ? rsi : na, "changeNegative (1)", "1", location.absolute, chart.fg_color)
plotchar(prevAbove70 ? 70.0 : na, "prevAbove70 (2)", "2", location.absolute, chart.fg_color)
plotchar(closeBelow ? close : na, "closeBelow (3)", "3", location.bottom, chart.fg_color)
plotchar(betweenLevels ? 60 : na, "betweenLevels (4)", "4", location.absolute, chart.fg_color)
plotchar(aboveMedian ? median : na, "aboveMedian (5)", "5", location.absolute, chart.fg_color)
注意:
- 每个
plotchar()
调用都使用一个
条件数作为
series参数。函数在状态行和数据窗口中显示数值。 - 除了条件调用之外,所有
plotchar()
调用都
closeBelow使用 location.absolute 作为参数,以便在字符不为 nalocation(即条件发生)时在精确位置显示字符 。调用使用 location.bottom 在窗格底部附近显示其字符。seriescloseBelow - 在本节的示例中,我们将各个条件分配给具有简单名称和注释的单独变量。虽然这种格式不是创建复合条件所必需的,因为可以直接在逻辑表达式中组合条件,但它可以使代码更易读,更易于调试,如 提示 部分所述。
字符串
字符串 是字母数字、控制字符和其他字符(例如 Unicode)的序列。它们在调试脚本时非常有用,因为程序员可以使用它们将脚本的数据类型表示为人类可读的文本,并使用具有 文本相关属性的绘图类型或使用 Pine Logs来检查它们。
表示其他类型
用户可以创建几乎任何数据类型的“字符串”表示,当其他方法可能不够用时,可以促进有效调试。在探索“字符串”检查技术之前,让我们简要回顾一下使用字符串表示脚本数据的方法。
Pine Script™ 包含预定义逻辑,用于构建其他几种内置类型的“字符串”表示形式,例如 int、 float、 bool、 array和 matrix 。脚本可以通过str.tostring() 和 str.format()函数方便地表示字符串等类型 。
例如,此代码片段使用以下函数创建字符串来表示多个值:
//@variable Returns: "1.25"
string floatRepr = str.tostring(1.25)
//@variable Returns: "1"
string rounded0 = str.tostring(1.25, "#")
//@variable Returns: "1.3"
string rounded1 = str.tostring(1.25, "#.#")
//@variable Returns: "1.2500"
string trailingZeros = str.tostring(1.25, "#.0000")
//@variable Returns: "true"
string trueRepr = str.tostring(true)
//@variable Returns: "false"
string falseRepr = str.tostring(5 == 3)
//@variable Returns: "[1, 2, -3.14]"
string floatArrayRepr = str.tostring(array.from(1, 2.0, -3.14))
//@variable Returns: "[2, 20, 0]"
string roundedArrayRepr = str.tostring(array.from(2.22, 19.6, -0.43), "#")
//@variable Returns: "[Hello, World, !]"
string stringArrayRepr = str.tostring(array.from("Hello", "World", "!"))
//@variable Returns: "Test: 2.718 ^ 2 > 5: true"
string mixedTypeRepr = str.format("{0}{1, number, #.###} ^ 2 > {2}: {3}", "Test: ", math.e, 5, math.e * math.e > 5)

//@variable Combines all the above strings into a multi-line string.
string combined = str.format(
     "{0}\n{1}\n{2}\n{3}\n{4}\n{5}\n{6}\n{7}\n{8}\n{9}",
     floatRepr, rounded0, rounded1, trailingZeros, trueRepr,
     falseRepr, floatArrayRepr, roundedArrayRepr, stringArrayRepr,
     mixedTypeRepr
 )
当使用表示 UNIX 时间戳的“int”值(例如从与时间相关的函数和变量返回的值)时,还可以使用 str.format() 或 str.format_time() 将它们转换为人类可读的日期字符串。此代码块演示了使用这些函数转换时间戳的多种方法:
//@variable A UNIX timestamp, in milliseconds.
int unixTime = 1279411200000

//@variable Returns: "2010-07-18T00:00:00+0000"
string default = str.format_time(unixTime)
//@variable Returns: "2010-07-18"
string ymdRepr = str.format_time(unixTime, "yyyy-MM-dd")
//@variable Returns: "07-18-2010"
string mdyRepr = str.format_time(unixTime, "MM-dd-yyyy")
//@variable Returns: "20:00:00, 2010-07-17"
string hmsymdRepr = str.format_time(unixTime, "HH:mm:ss, yyyy-MM-dd", "America/New_York")
//@variable Returns: "Year: 2010, Month: 07, Day: 18, Time: 12:00:00"
string customFormat = str.format(
     "Year: {0, time, yyyy}, Month: {1, time, MM}, Day: {2, time, dd}, Time: {3, time, hh:mm:ss}",
     unixTime, unixTime, unixTime, unixTime
 )
当使用没有内置“字符串”表示的类型(例如 color、 map、 用户定义类型等)时,程序员可以使用自定义逻辑或格式来构造表示。例如,此代码调用 str.format()来使用其r、 g、 b和 t 组件 来表示“颜色”值 :
//@variable The built-in `color.maroon` value with 17% transparency.
color myColor = color.new(color.maroon, 17)

// Get the red, green, blue, and transparency components from `myColor`.
float r = color.r(myColor)
float g = color.g(myColor)
float b = color.b(myColor)
float t = color.t(myColor)

//@variable Returns: "color (r = 136, g = 14, b = 79, t = 17)"
string customRepr = str.format("color (r = {0}, g = {1}, b = {2}, t = {3})", r, g, b, t)
使用字符串表示数据的方式有无数种。选择用于调试的字符串格式时,请确保结果 可读并提供足够的信息以供正确检查。以下部分解释了通过使用标签在图表上显示字符串来验证字符串的方法,这些部分之后的部分解释了如何在Pine Logs窗格中将字符串显示为消息。
使用标签
标签允许脚本在图表上的任何可用位置显示动态文本(“系列字符串”)。在图表上显示此类文本的位置取决于程序员想要检查的信息及其调试偏好。
在连续的条形图上
当检查影响图表比例的值的历史记录或使用具有不同类型的多个系列时,一种简单方便的调试方法是绘制 在连续的条形上显示 字符串表示形式的标签。
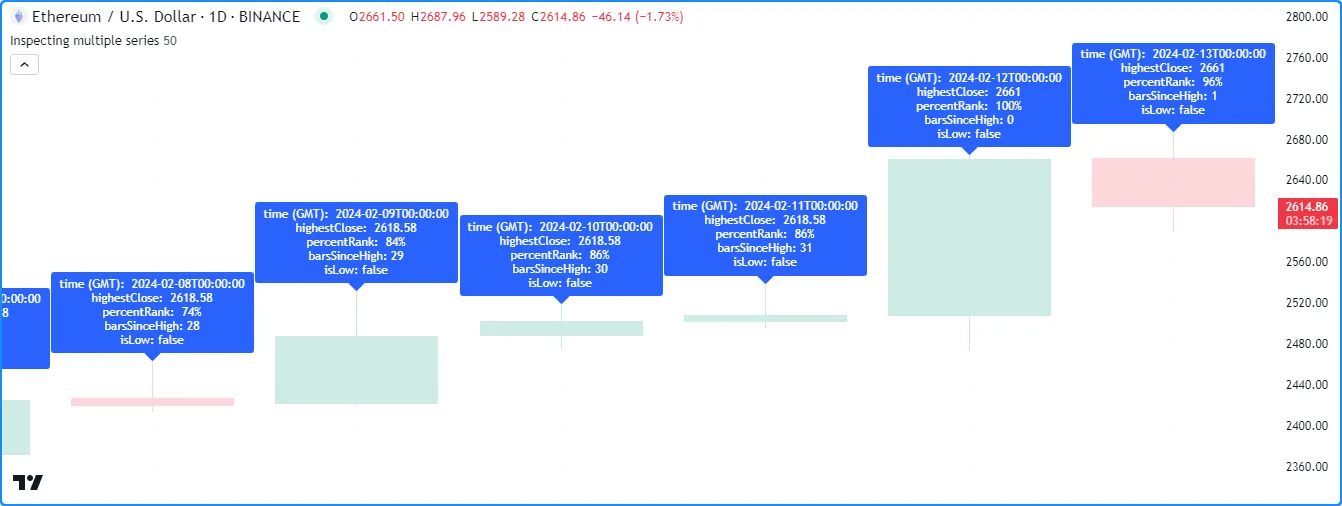
例如,此脚本计算四个系列:highestClose、、
和。它使用
str.format()
创建表示系列值和时间戳的格式化“字符串”,然后调用
label.new()
绘制一个
标签percentRank,在每个条形图的最高点
显示结果
:barsSinceHighisLow
//@version=5
indicator("Labels on successive bars demo", "Inspecting multiple series", true, max_labels_count = 500)

//@variable The number of bars in the calculation window.
int lengthInput = input.int(50, "Length", 1)

//@variable The highest `close` over `lengthInput` bars.
float highestClose = ta.highest(close, lengthInput)
//@variable The percent rank of the current `close` compared to previous values over `lengthInput` bars.
float percentRank = ta.percentrank(close, lengthInput)
//@variable The number of bars since the `close` was equal to the `highestClose`.
int barsSinceHigh = ta.barssince(close == highestClose)
//@variable Is `true` when the `percentRank` is 0, i.e., when the `close` is the lowest.
bool isLow = percentRank == 0.0

//@variable A multi-line string representing the `time`, `highestClose`, `percentRank`, `barsSinceHigh`, and `isLow`.
string debugString = str.format(
     "time (GMT): {0, time, yyyy-MM-dd'T'HH:mm:ss}\nhighestClose: {1, number, #.####}
     \npercentRank: {2, number, #.##}%\nbarsSinceHigh: {3, number, integer}\nisLow: {4}",
     time, highestClose, percentRank, barsSinceHigh, isLow
 )

//@variable Draws a label showing the `debugString` at each bar's `high`.
label debugLabel = label.new(chart.point.now(high), debugString, textcolor = color.white)
虽然上述示例允许人们在任意带有标签绘图的条形图上检查脚本系列的结果 ,但是像这样的连续绘图可能会使图表变得混乱,尤其是在查看较长的字符串时。
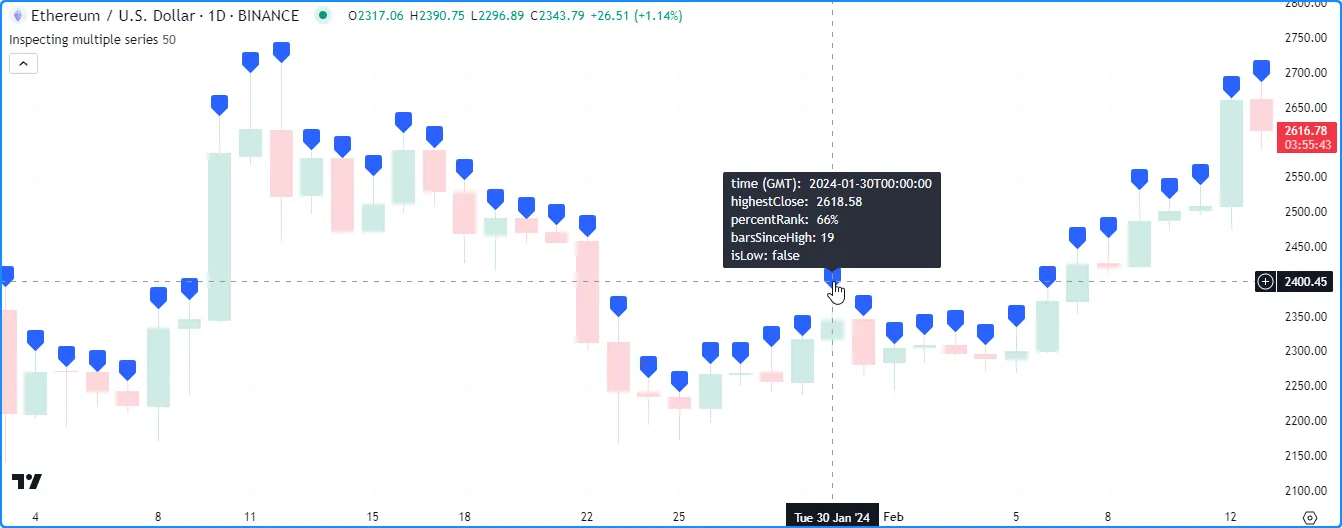
另一种更直观、更紧凑的方式来检查带有标签的连续条形的值,就是利用tooltip属性而不是属性text
,因为
标签
只会在光标悬停在其上时显示其工具提示。
下面,我们修改了之前的脚本,使用debugString作为tooltip参数而不是label.new()text调用中的参数
。现在,我们可以查看特定条形图上的结果,而没有额外的噪音:
//@version=5
indicator("Tooltips on successive bars demo", "Inspecting multiple series", true, max_labels_count = 500)

//@variable The number of bars in the calculation window.
int lengthInput = input.int(50, "Length", 1)

//@variable The highest `close` over `lengthInput` bars.
float highestClose = ta.highest(close, lengthInput)
//@variable The percent rank of the current `close` compared to previous values over `lengthInput` bars.
float percentRank = ta.percentrank(close, lengthInput)
//@variable The number of bars since the `close` was equal to the `highestClose`.
int barsSinceHigh = ta.barssince(close == highestClose)
//@variable Is `true` when the `percentRank` is 0, i.e., when the `close` is the lowest.
bool isLow = percentRank == 0.0

//@variable A multi-line string representing the `time`, `highestClose`, `percentRank`, `barsSinceHigh`, and `isLow`.
string debugString = str.format(
     "time (GMT): {0, time, yyyy-MM-dd'T'HH:mm:ss}\nhighestClose: {1, number, #.####}
     \npercentRank: {2, number, #.##}%\nbarsSinceHigh: {3, number, integer}\nisLow: {4}",
     time, highestClose, percentRank, barsSinceHigh, isLow
 )

//@variable Draws a label showing the `debugString` in a tooltip at each bar's `high`.
label debugLabel = label.new(chart.point.now(high), tooltip = debugString)
值得注意的是,脚本最多可以显示 500 个 标签 图,这意味着上述示例只允许用户检查最近 500 个图表条中的字符串。
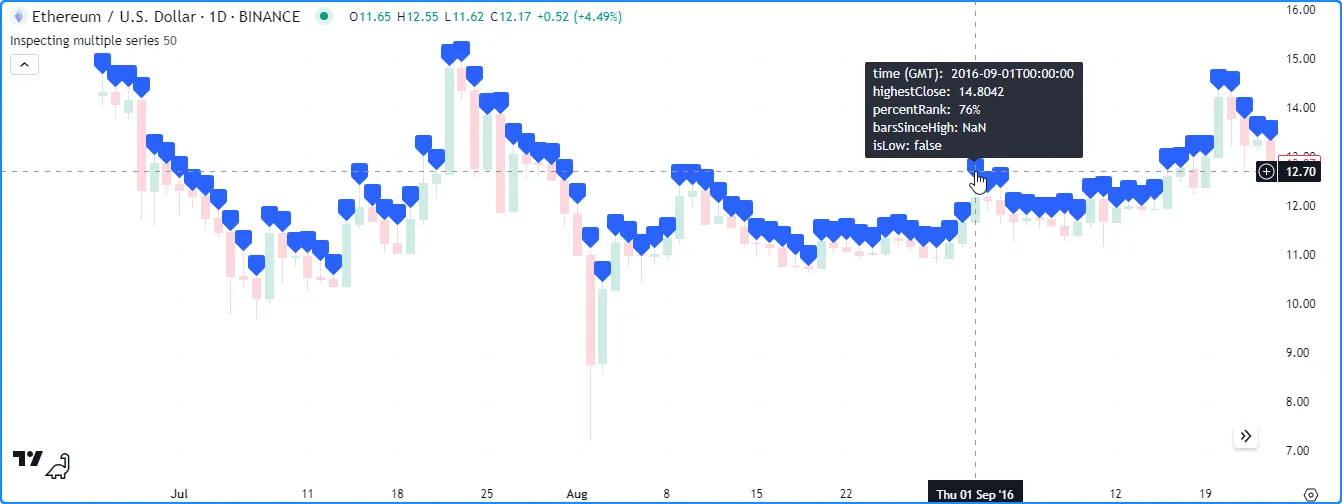
如果程序员想要查看早期图表条的结果,一种方法是创建条件逻辑,仅允许在特定时间范围内绘图,例如:
if time >= startTime and time <= endTime
    <create_drawing_id>
如果我们在前面的示例中使用此结构,并将
chart.left_visible_bar_time
和
chart.right_visible_bar_time
作为startTime和endTime值,则脚本将仅
在
可见的图表条上创建标签,并避免在其他条上绘制。 使用此逻辑,我们可以滚动查看任何图表条上的标签,只要
可见范围内最多有条:max_labels_count
//@version=5
indicator("Tooltips on visible bars demo", "Inspecting multiple series", true, max_labels_count = 500)

//@variable The number of bars in the calculation window.
int lengthInput = input.int(50, "Length", 1)

//@variable The highest `close` over `lengthInput` bars.
float highestClose = ta.highest(close, lengthInput)
//@variable The percent rank of the current `close` compared to previous values over `lengthInput` bars.
float percentRank = ta.percentrank(close, lengthInput)
//@variable The number of bars since the `close` was equal to the `highestClose`.
int barsSinceHigh = ta.barssince(close == highestClose)
//@variable Is `true` when the `percentRank` is 0, i.e., when the `close` is the lowest.
bool isLow = percentRank == 0.0

//@variable A multi-line string representing the `time`, `highestClose`, `percentRank`, `barsSinceHigh`, and `isLow`.
string debugString = str.format(
     "time (GMT): {0, time, yyyy-MM-dd'T'HH:mm:ss}\nhighestClose: {1, number, #.####}
     \npercentRank: {2, number, #.##}%\nbarsSinceHigh: {3, number, integer}\nisLow: {4}",
     time, highestClose, percentRank, barsSinceHigh, isLow
 )

if time >= chart.left_visible_bar_time and time <= chart.right_visible_bar_time
    //@variable Draws a label showing the `debugString` in a tooltip at each visible bar's `high`.
    label debugLabel = label.new(chart.point.now(high), tooltip = debugString)
注意:
- 如果可见图表包含的条形图数量超过允许的绘制数量,则脚本将仅显示可见范围内最新条形图的结果。要使用此技术获得最佳效果,请放大图表以将可见范围限制在允许的绘制数量内。
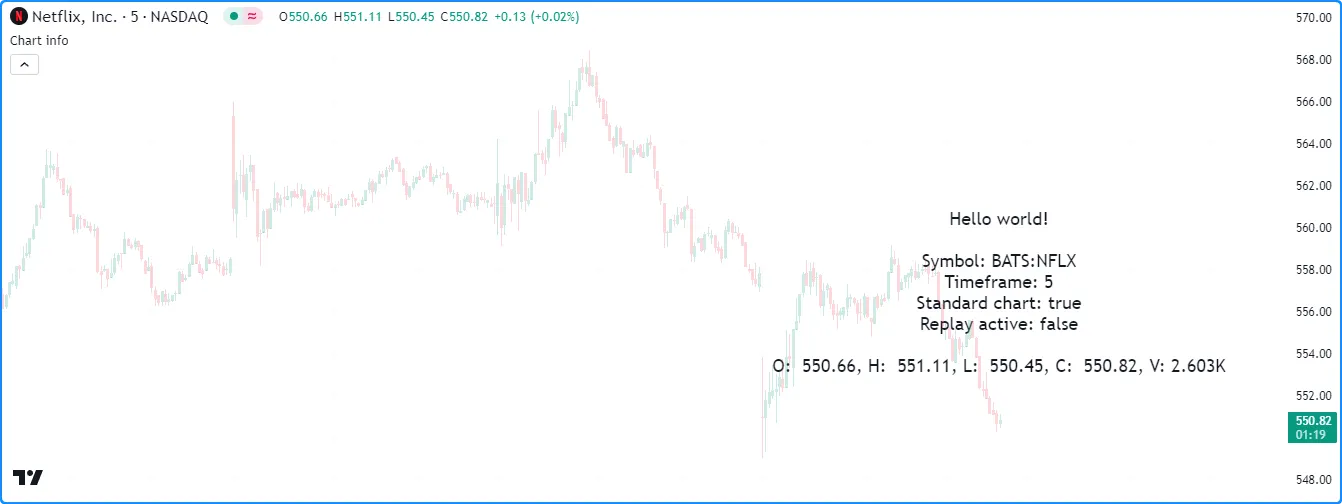
在图表的末尾
调试带有标签的脚本字符串的常用方法 是将它们显示在图表的末尾,即当字符串不变或只有特定条的值需要分析时。
下面的脚本包含一个用户定义的printLabel()函数,无论脚本何时调用它,它都会在图表上的最后一个可用时间绘制
标签
。我们在本例中使用该函数显示“Hello world!”字符串、一些基本图表信息以及数据馈送的当前 OHLCV 值:
//@version=5
indicator("Labels at the end of the chart demo", "Chart info", true)

//@function     Draws a label to print the `txt` at the last available time on the chart.
//              When called from the global scope, the label updates its text using the specified `txt` on every bar.
//@param txt    The string to display on the chart.
//@param price  The optional y-axis location of the label. If not specified, draws the label above the last chart bar.
//@returns      The resulting label ID.
printLabel(string txt, float price = na) =>
    int labelTime = math.max(last_bar_time, chart.right_visible_bar_time)
    var label result = label.new(
         labelTime, na, txt, xloc.bar_time, na(price) ? yloc.abovebar : yloc.price, na,
         label.style_none, chart.fg_color, size.large
     )
    label.set_text(result, txt)
    label.set_y(result, price)
    result

//@variable A formatted string containing information about the current chart.
string chartInfo = str.format(
     "Symbol: {0}:{1}\nTimeframe: {2}\nStandard chart: {3}\nReplay active: {4}",
     syminfo.prefix, syminfo.ticker, timeframe.period, chart.is_standard,
     str.contains(syminfo.tickerid, "replay")
 )

//@variable A formatted string containing OHLCV values.
string ohlcvInfo = str.format(
     "O: {0, number, #.#####}, H: {1, number, #.#####}, L: {2, number, #.#####}, C: {3, number, #.#####}, V: {4}",
     open, high, low, close, str.tostring(volume, format.volume)
 )

// Print "Hello world!" and the `chartInfo` at the end of the chart on the first bar.
if barstate.isfirst
    printLabel("Hello world!" + "\n\n\n\n\n\n\n")
    printLabel(chartInfo + "\n\n")

// Print current `ohlcvInfo` at the end of the chart, updating the displayed text as new data comes in.
printLabel(ohlcvInfo)
注意:
- 该函数
使用
last_bar_time
和
chart.right_visible_bar_time
的
最大值设置绘制标签
printLabel()的 x 坐标, 以确保它始终在最后一个可用条中显示结果。 - 当从全局范围调用时,该函数会创建一个
标签
,其
text属性y会在每条柱状图上更新。 - 我们对该函数进行了三次调用,并添加了换行符( ),以演示如果字符串具有足够的行距,用户可以在图表末尾叠加多个标签
\n的结果 。
使用表格
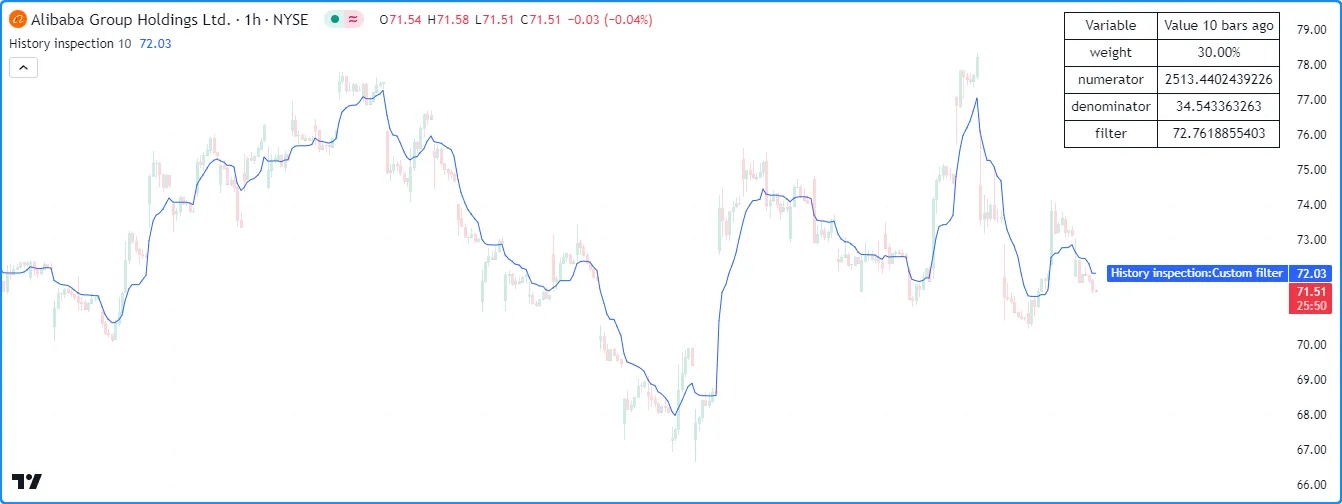
表格在单元格内显示字符串,这些字符串按列和行排列在相对于图表窗格的可视空间的固定位置。它们可以用作基于图表的多功能调试工具,因为与 标签不同,它们允许程序员在有组织的可视结构中检查一个或多个“系列字符串”,而不受图表比例或条形索引的影响。
例如,此脚本计算自定义值,其结果是
加权
收盘价的EMA
与
系列
的EMAfilter的比率
。为了检查计算中使用的变量,它会在第一个条形图上创建一个
表格
实例,在最后一个历史条形图上初始化表格的单元格,然后用最新图表条形图上前几条形图值的“字符串”表示来更新必要的单元格:weightbarsBack
//@version=5
indicator("Debugging with tables demo", "History inspection", true)

//@variable The number of bars back in the chart's history to inspect.
int barsBack = input.int(10, "Bars back", 0, 4999)

//@variable The percent rank of `volume` over 10 bars.
float weight = ta.percentrank(volume, 10)
//@variable The 10-bar EMA of `weight * close` values.
float numerator = ta.ema(weight * close, 10)
//@variable The 10-bar EMA of `weight` values.
float denominator = ta.ema(weight, 10)
//@variable The ratio of the `numerator` to the `denominator`.
float filter = numerator / denominator

// Plot the `filter`.
plot(filter, "Custom filter")

//@variable The color of the frame, border, and text in the `debugTable`.
color tableColor = chart.fg_color

//@variable A table that contains "string" representations of variable names and values on the latest chart bar.
var table debugTable = table.new(
     position.top_right, 2, 5, frame_color = tableColor, frame_width = 1, border_color = tableColor, border_width = 1
 )

// Initialize cells on the last confirmed historical bar.
if barstate.islastconfirmedhistory
    table.cell(debugTable, 0, 0, "Variable", text_color = tableColor)
    table.cell(debugTable, 1, 0, str.format("Value {0, number, integer} bars ago", barsBack), text_color = tableColor)
    table.cell(debugTable, 0, 1, "weight", text_color = tableColor)
    table.cell(debugTable, 1, 1, "", text_color = tableColor)
    table.cell(debugTable, 0, 2, "numerator", text_color = tableColor)
    table.cell(debugTable, 1, 2, "", text_color = tableColor)
    table.cell(debugTable, 0, 3, "denominator", text_color = tableColor)
    table.cell(debugTable, 1, 3, "", text_color = tableColor)
    table.cell(debugTable, 0, 4, "filter", text_color = tableColor)
    table.cell(debugTable, 1, 4, "", text_color = tableColor)

// Update value cells on the last available bar.
if barstate.islast
    table.cell_set_text(debugTable, 1, 1, str.tostring(weight[barsBack], format.percent))
    table.cell_set_text(debugTable, 1, 2, str.tostring(numerator[barsBack]))
    table.cell_set_text(debugTable, 1, 3, str.tostring(denominator[barsBack]))
    table.cell_set_text(debugTable, 1, 4, str.tostring(filter[barsBack]))
注意:
- 该脚本使用
var
关键字来指定分配
给第一个条形图上的变量的表
debugTable在整个脚本执行过程中保持不变。 - 此脚本在两个if结构内修改表格
。第一个结构
仅在最后确认的历史条 ( barstate.islastconfirmedhistory ) 上使用table.cell()
初始化单元格
。第二个结构使用table.cell_set_text()
调用最新可用条 ( barstate.islast ) ,使用我们变量值的
字符串表示形式更新相关单元格的属性
。
text
需要注意的是,尽管表格可以提供调试实用程序,即在处理多个系列或创建图表日志时,但它们的计算成本比本页讨论的其他技术更高,并且可能需要更多代码。此外,与 标签不同,只能从最新的脚本执行中查看表格的状态。因此,我们建议在调试时明智而谨慎地使用它们 ,尽可能选择简化的方法。有关使用 表格 对象的更多信息,请参阅表格 页面。
松木
Pine Logs 是脚本在执行过程中特定点输出的交互式消息。它们为程序员提供了一种强大的方法,让他们能够以最少的代码检查脚本的数据、条件和执行流程。
与本页讨论的其他工具不同,Pine Logs 经过精心设计,可用于深入脚本调试。脚本不会在图表或数据窗口中显示 Pine Logs。相反,它们会在专用的Pine Logs 窗格中打印带有时间戳的消息,该窗格提供专门的导航功能和过滤选项。
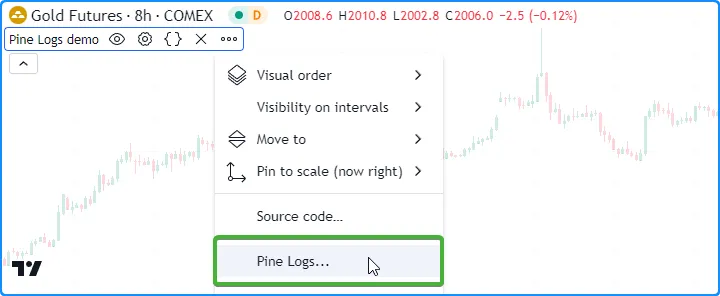
log.*()要访问 Pine Logs 窗格,请从编辑器的“更多”菜单或从使用函数的图表上加载的脚本的“更多”菜单中选择“Pine Logs...” :
创建日志
脚本可以通过调用命名空间中的函数来创建日志log.*()
。
所有log.*()函数均具有以下签名:
log.*(message) → void
log.*(formatString, arg0, arg1, ...) → void第一个重载记录messagePine Logs 窗格中指定的内容。第二个重载类似于
str.format(),因为它根据formatString调用中提供的附加参数记录格式化的消息。
每个log.*()函数都有不同的调试级别,允许程序员对窗格中显示的结果进行分类和
过滤:
- log.info ()函数记录窗格中以灰色文本显示的“信息”级别 的条目。
- log.warning ()函数记录窗格中以橙色文本显示的“警告”级别 的条目。
- log.error ()函数记录窗格中以红色文本显示的“错误”级别 的条目。
此代码演示了这三个函数之间的区别。它
在第一个可用条形上log.*()
调用
log.info()、
log.warning()和
log.error() :
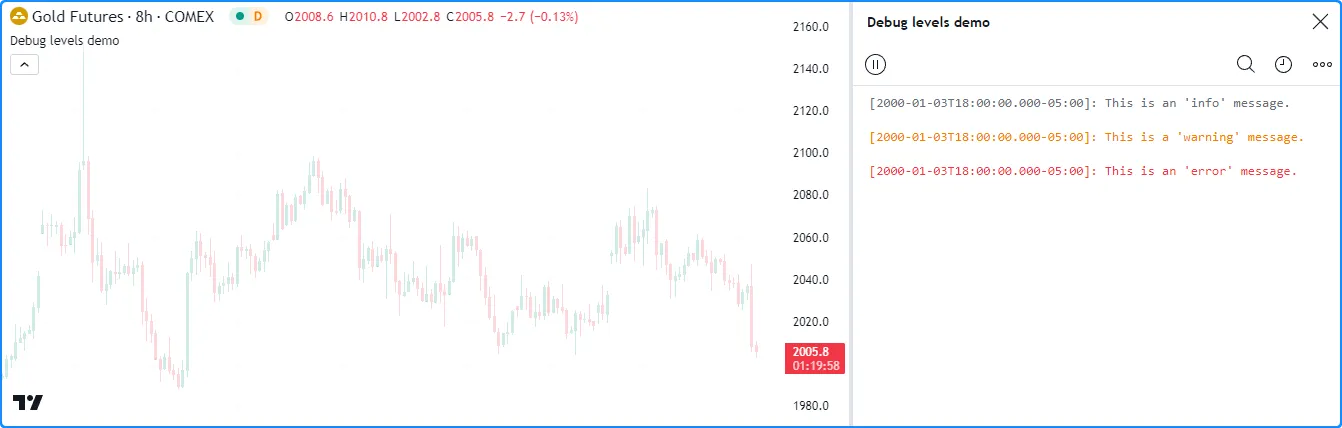
//@version=5
indicator("Debug levels demo", overlay = true)

if barstate.isfirst
    log.info("This is an 'info' message.")
    log.warning("This is a 'warning' message.")
    log.error("This is an 'error' message.")
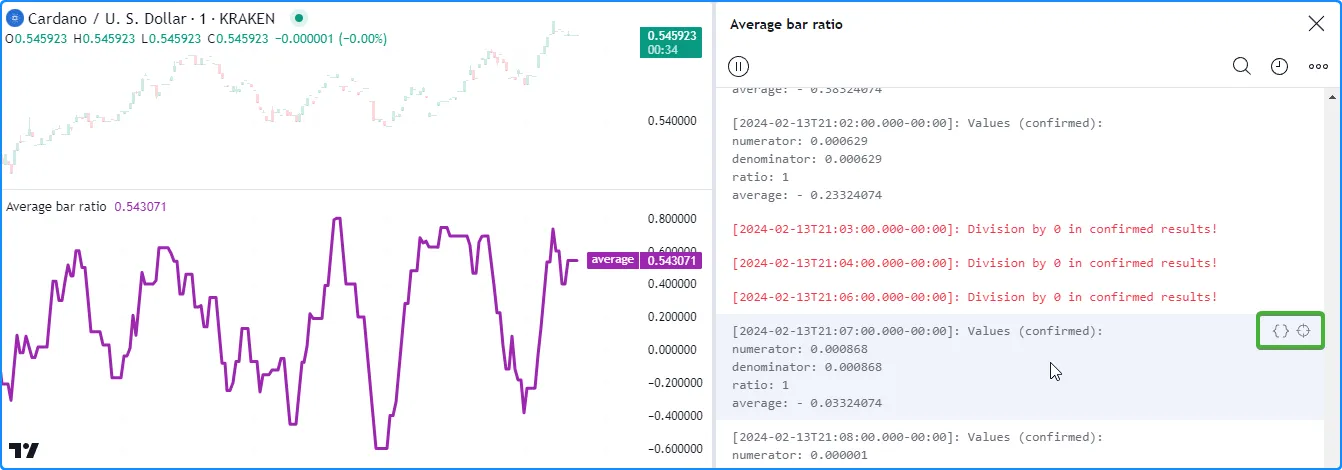
Pine Logs 可以在脚本执行过程中的任何地方执行。它们允许程序员跟踪历史条形图的信息并监控其脚本在实时、未确认条形图上的行为。在历史条形图上执行时,脚本会为条形图上的每次调用生成一次新消息log.*()
。在实时条形图上,对函数的调用可以在每个新报价log.*()上创建新条目。
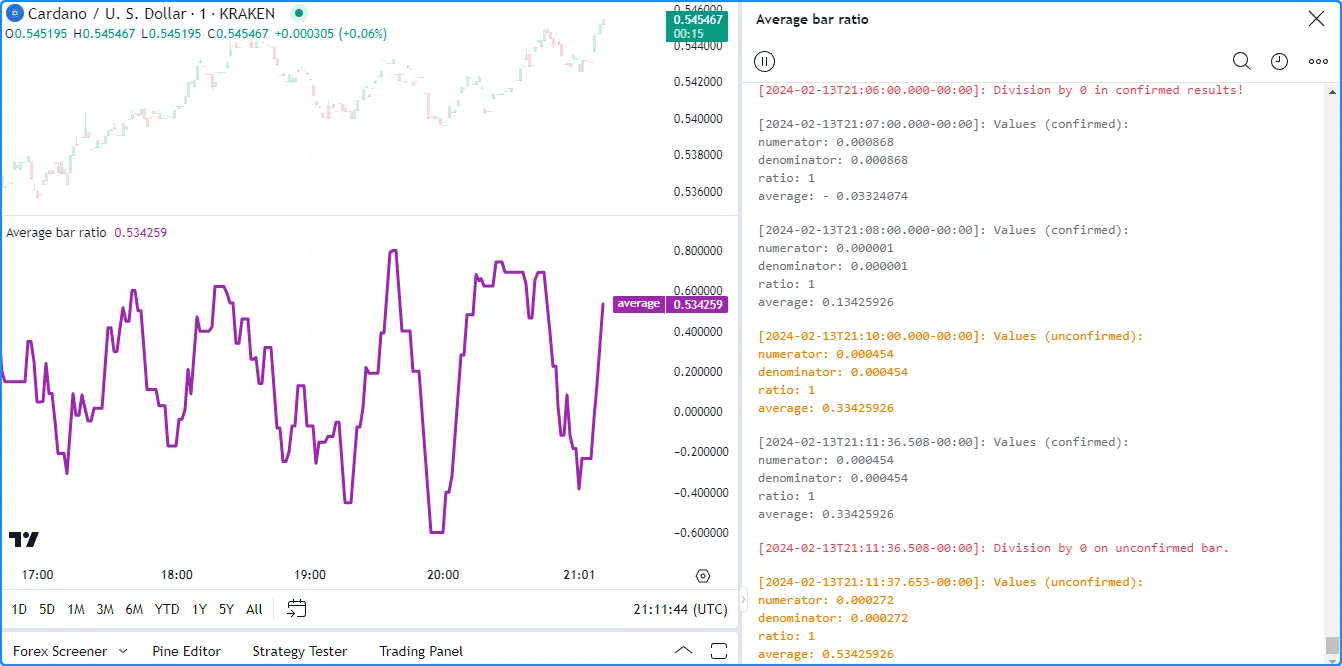
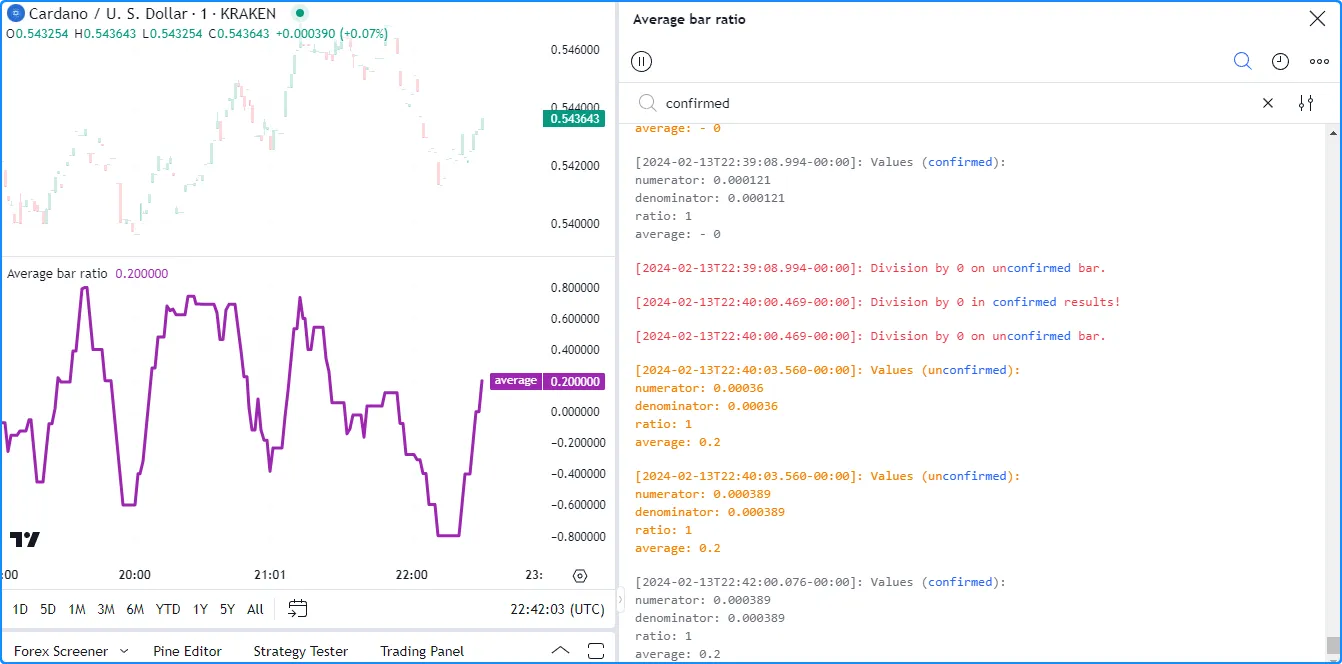
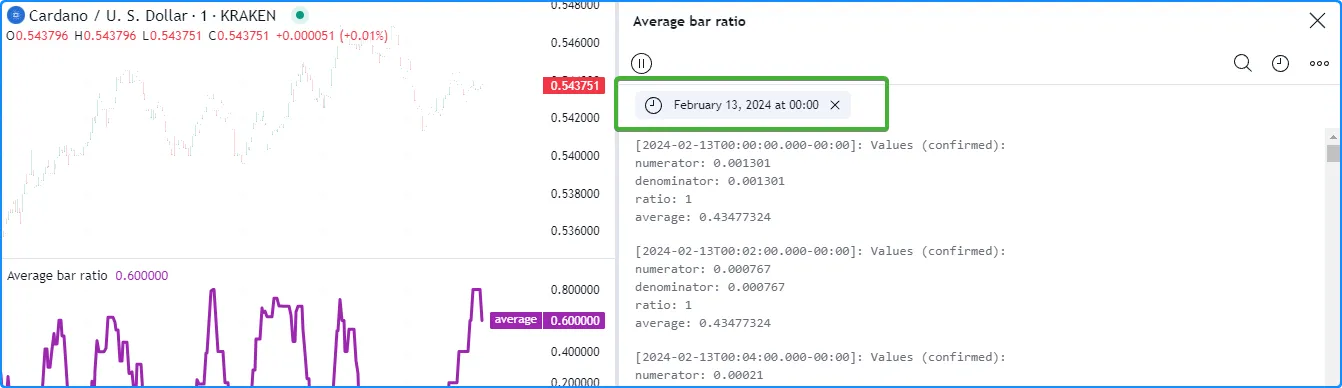
例如,此脚本计算每个条形图的close - open值与其high - low范围之间的平均比率。当
denominator不为零时,脚本将调用
log.info()
以在已确认的条形图上打印计算变量的值,并
调用 log.warning()
以在未确认的条形图上打印值。否则,它使用
log.error()
来指示发生了除以零的情况,因为这种情况会影响结果
average:
//@version=5
indicator("Logging historical and realtime data demo", "Average bar ratio")
//@variable The current bar's change from the `open` to `close`.
float numerator = close - open
//@variable The current bar's `low` to `high` range.
float denominator = high - low
//@variable The ratio of the bar's open-to-close range to its full range.
float ratio = numerator / denominator
//@variable The average `ratio` over 10 non-na values.
float average = ta.sma(ratio, 10)
// Plot the `average`.
plot(average, "average", color.purple, 3)
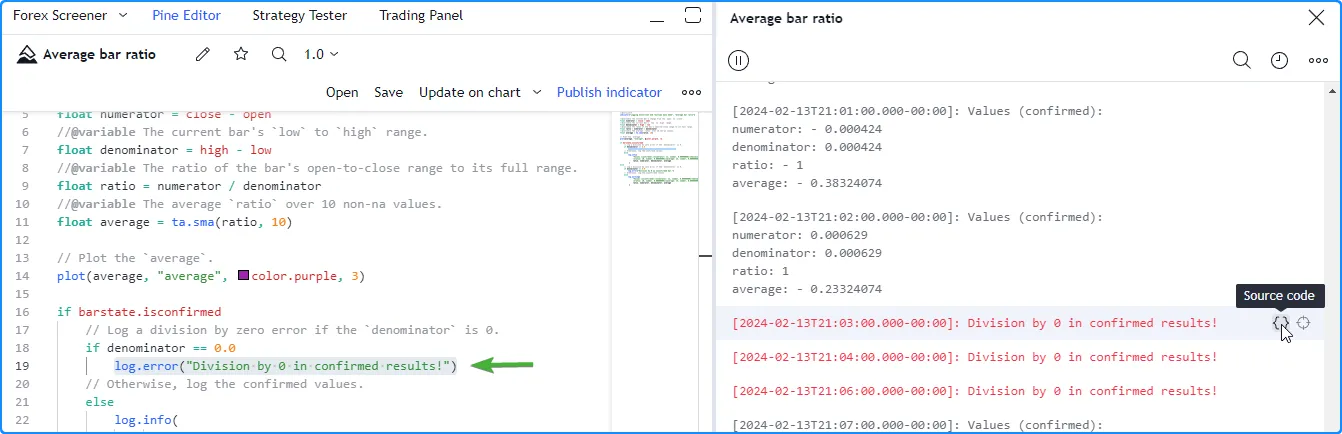
if barstate.isconfirmed
// Log a division by zero error if the `denominator` is 0.
if denominator == 0.0
log.error("Division by 0 in confirmed results!")
// Otherwise, log the confirmed values.
else
log.info(
"Values (confirmed):\nnumerator: {1, number, #.########}\ndenominator: {2, number, #.########}
\nratio: {0, number, #.########}\naverage: {3, number, #.########}",
ratio, numerator, denominator, average
)
else
// Log a division by zero error if the `denominator` is 0.
if denominator == 0.0
log.error("Division by 0 on unconfirmed bar.")
// Otherwise, log the unconfirmed values.
else
log.warning(
"Values (unconfirmed):\nnumerator: {1, number, #.########}\ndenominator: {2, number, #.########}
\nratio: {0, number, #.########}\naverage: {3, number, #.########}",
ratio, numerator, denominator, average
)
注意:
- Pine Logs不会在未确认的条形图上回滚每个报价,这意味着这些报价的结果会显示在窗格中,直到脚本重新开始执行。若要仅记录
已确认条形图上的消息,请
在触发调用的条件下使用barstate.isconfirmed
log.*()。 - 当登录未确认的条形图时,我们建议确保这些日志包含唯一信息或使用不同的调试级别,以便您可以 根据需要过滤结果。
- Pine Logs 窗格将显示历史条形图的最近 10,000 条条目。如果脚本在历史条形图上生成超过 10,000 条日志,并且程序员需要查看更早的条目,他们可以使用条件逻辑将调用限制
log.*()在特定事件上。请参阅 本节以获取将日志生成限制在用户指定的时间范围内的示例。
检查日志
Pine Logs 包含一些有用的功能,可简化检查过程。每当脚本生成日志时,它都会自动在消息前加上精细的时间戳,以表示日志事件在时间序列中发生的位置。此外,每个条目都包含 “源代码”和“滚动到栏”图标,在 Pine Logs 窗格中将鼠标悬停在条目上时会出现这些图标:
单击条目的“源代码”图标将在 Pine 编辑器中打开脚本并突出显示触发日志的特定代码行:
单击条目的“滚动到条形图”图标可将图表导航到日志发生的特定条形图,然后暂时显示包含该条形图时间信息的工具提示:
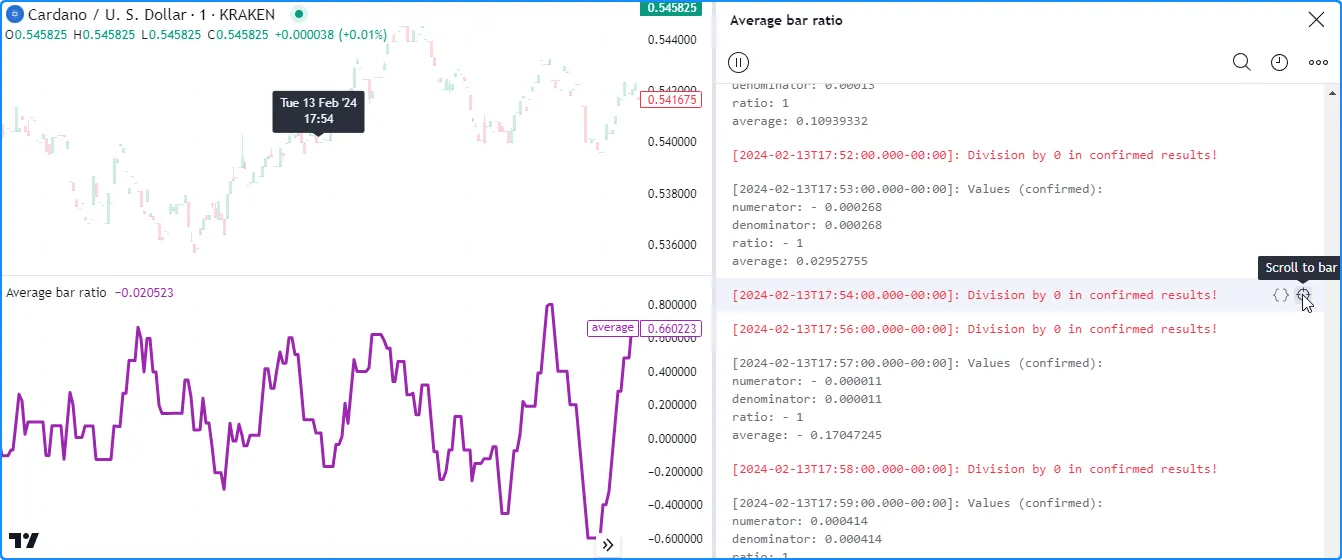
注意:
- 工具提示中的时间信息取决于图表的时间范围,就像链接到图表光标和绘图工具的 x 轴标签一样。例如,EOD 图表上的工具提示将仅显示星期几和日期,而 10 秒图表上的工具提示还将包含一天中的时间,包括秒数。
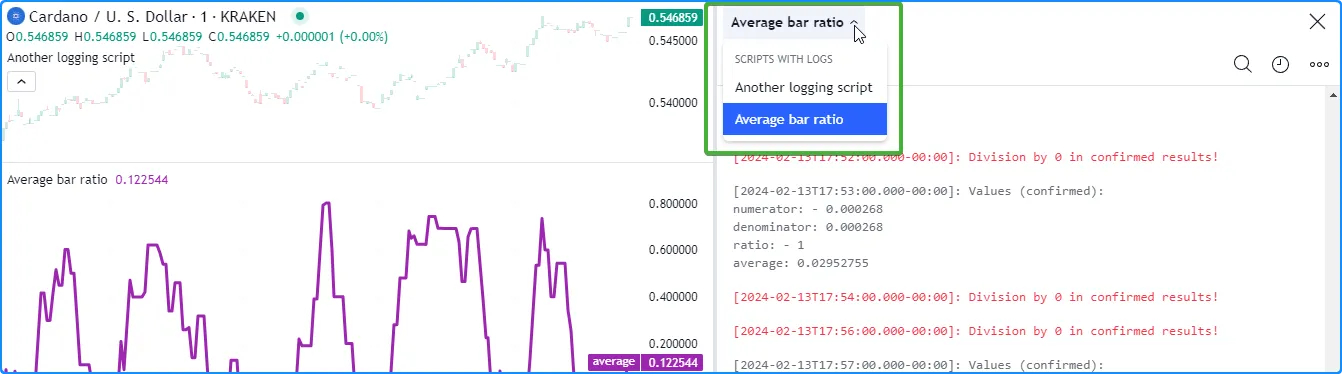
当图表包含多个生成日志的脚本时,请务必注意每个脚本都维护自己独立的 消息历史记录。要在图表上有多个脚本时检查特定脚本的消息,请从 Pine Logs 窗格顶部的下拉列表中选择其标题:
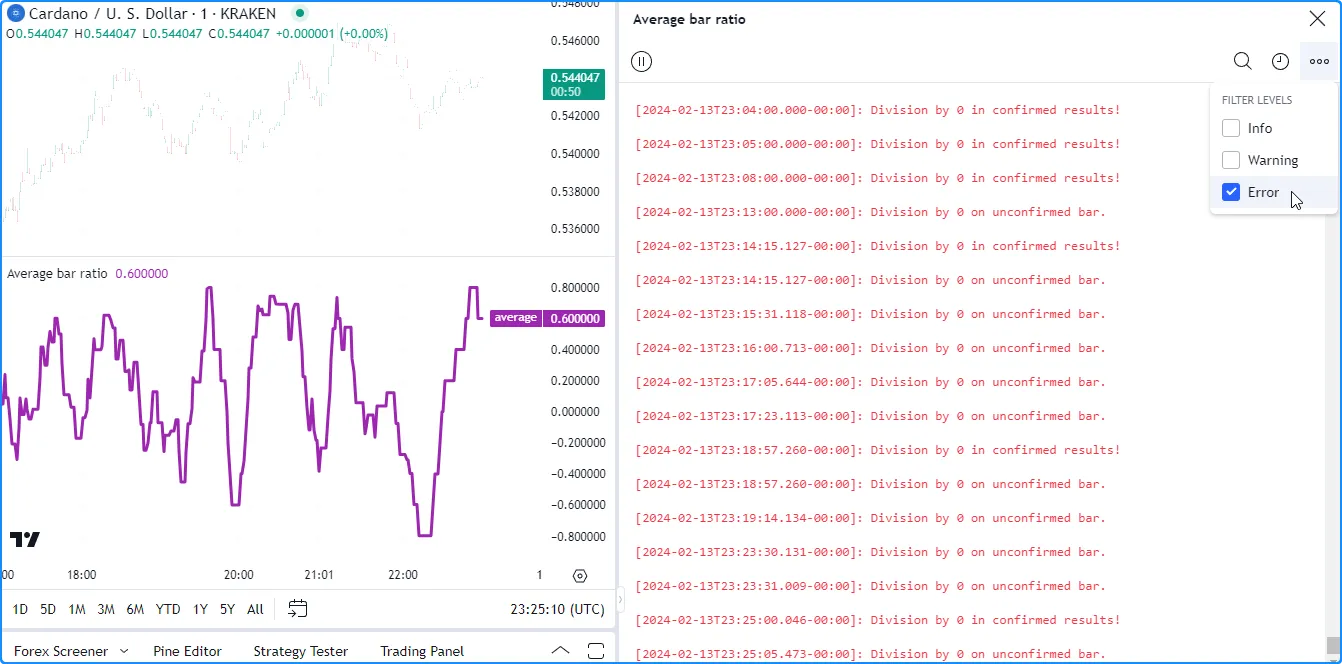
过滤日志
单个脚本可以生成大量日志,具体取决于触发其调用的条件log.*()。当脚本仅生成少量日志时,直接滚动查看日志历史记录以查找特定条目可能就足够了,但在搜索数百或数千条消息时,这种方法就变得很麻烦。
Pine Logs 窗格包含多个用于过滤消息的选项,允许通过隔离特定的 字符序列、开始时间和调试级别来简化其结果。
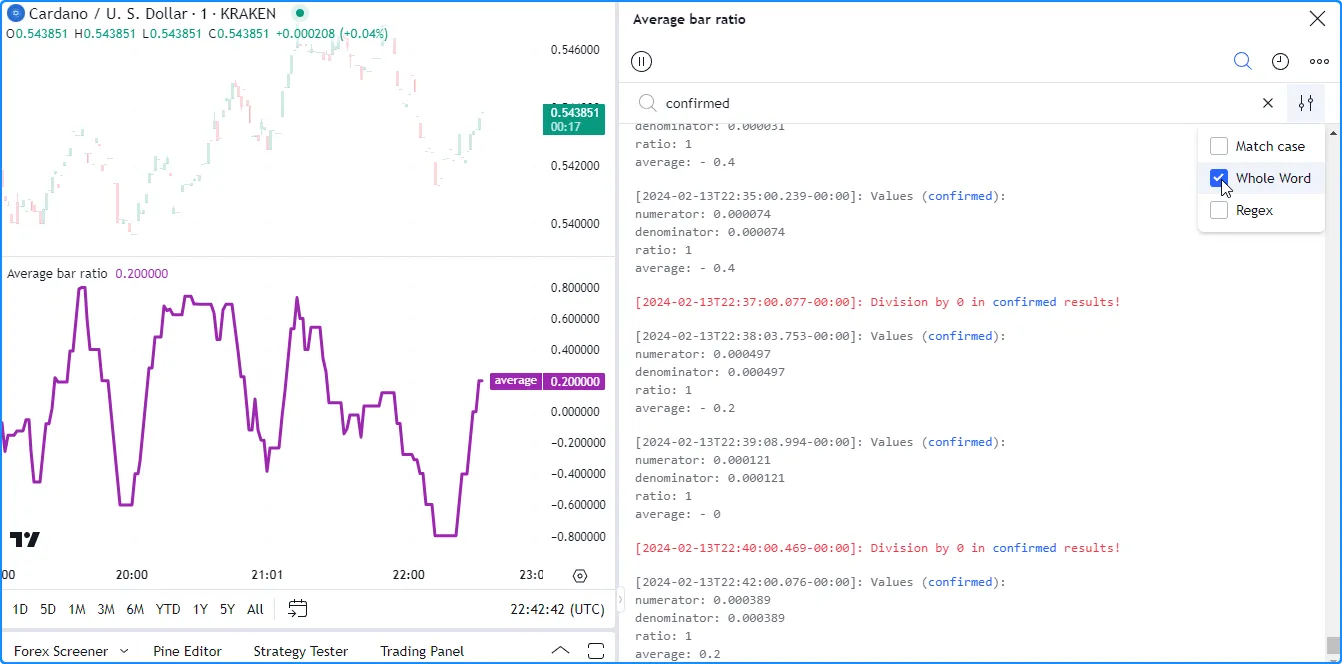
单击窗格顶部的“搜索”图标将打开一个搜索栏,该搜索栏会匹配文本以过滤已记录的消息。搜索过滤器还会以蓝色突出显示每条消息的匹配部分以供参考。例如,在这里,我们输入“confirmed”以匹配我们之前的脚本生成的所有结果,其中文本中的某个单词:
请注意,此搜索的结果还将带有 “未确认”的消息视为匹配项,因为该词包含我们的查询。我们可以通过在搜索栏右侧的选项中选择“全词”复选框来忽略这些匹配项:
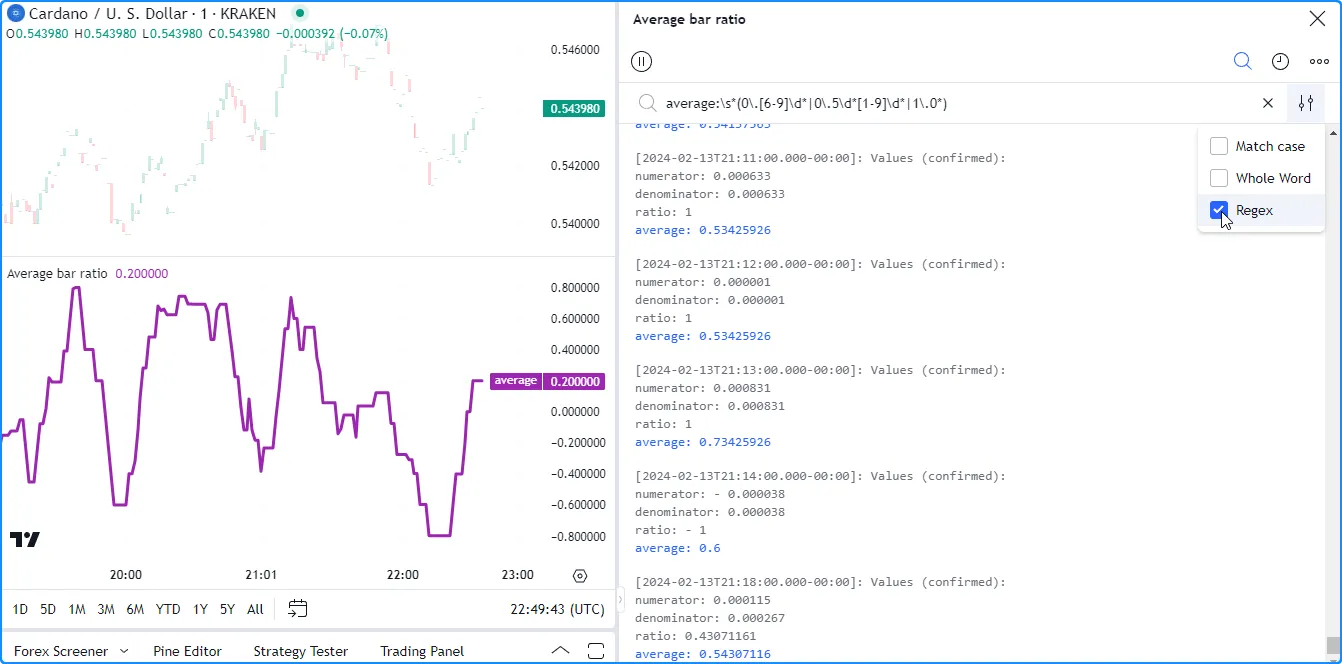
此过滤器还支持正则表达式 (regex),允许用户在搜索选项中选择“Regex”复选框时执行匹配自定义字符模式的高级搜索。例如,此正则表达式匹配所有包含“average”后跟表示大于 0.5 且小于或等于 1 的数字的序列的条目:
average:\s*(0\.[6-9]\d*|0\.5\d*[1-9]\d*|1\.0*)
单击“开始日期”图标将打开一个对话框,允许用户指定结果中显示的第一个日志的日期和时间:
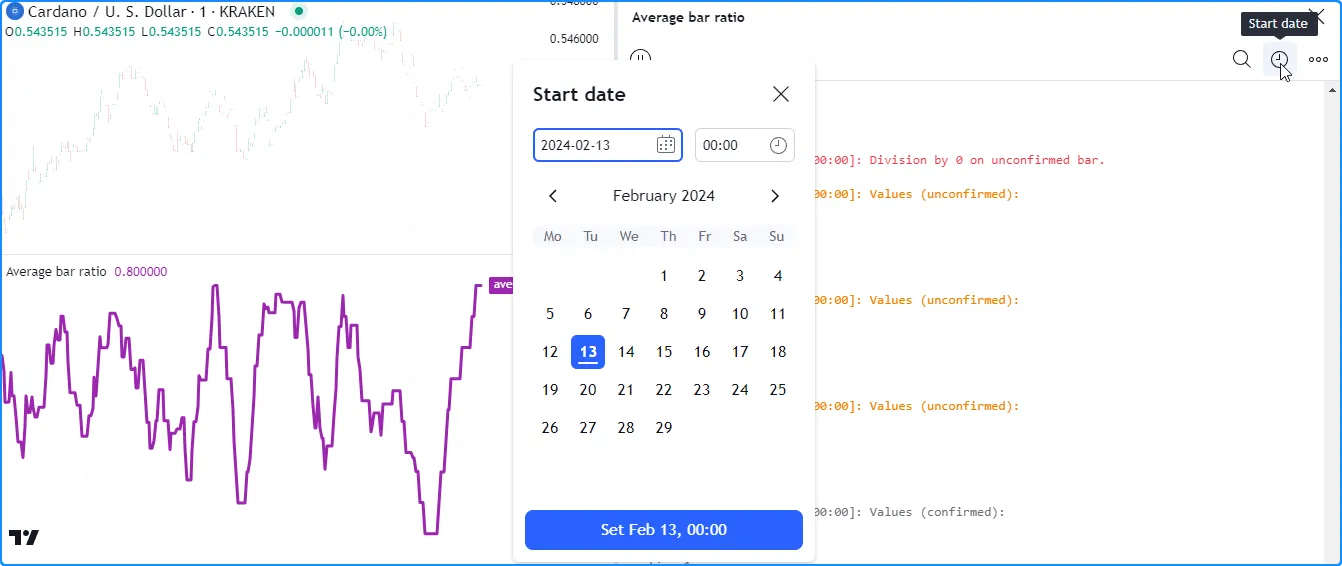
指定起点后,日志历史上方会出现一个包含开始时间的标签:
用户可以使用选择过滤选项中最右侧图标时可用的复选框按调试级别过滤结果。在这里,我们停用了“信息”和“警告”级别,因此结果将仅包含“错误”消息:
使用输入
以交互方式过滤脚本记录结果的另一种更复杂的方法是创建
与条件逻辑链接的输入log.*(),以激活代码中的特定调用。
让我们看一个例子。此代码计算
收盘价
的
RMA
,并声明一些唯一条件以形成
复合条件。该脚本使用
log.info()
在 Pine Logs 窗格中显示重要的调试信息,包括变量的值和确定其结果的“bool”变量。compoundCondition
我们声明了filterLogsInput、logStartInput和logEndInput
变量,分别将其分配给一个
input.bool()
和两个
input.time()
调用,以进行自定义日志过滤。当filterLogsInput为 时true,脚本只会在条形图的
时间
介于logStartInput和logEndInput值之间时生成新日志,从而使我们能够以交互方式隔离特定时间范围内发生的条目:
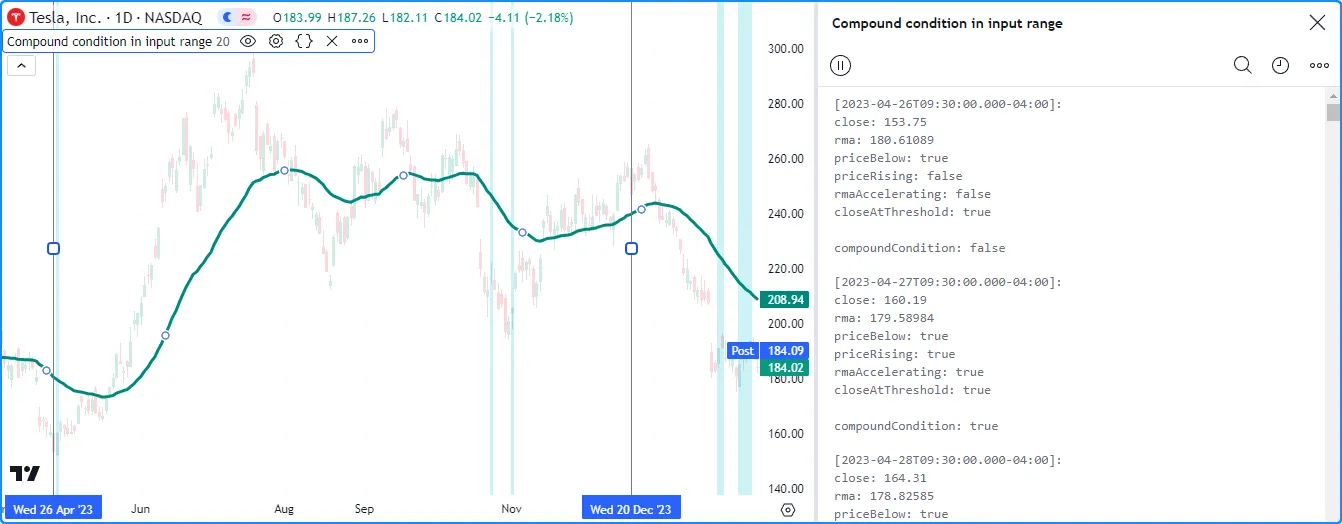
//@version=5
indicator("Filtering logs using inputs demo", "Compound condition in input range", true)

//@variable The length for moving average calculations.
int lengthInput = input.int(20, "Length", 2)

//@variable If `true`, only allows logs within the input time range.
bool filterLogsInput = input.bool(true, "Only log in time range", group = "Log filter")
//@variable The starting time for logs if `filterLogsInput` is `true`.
int logStartInput = input.time(0, "Start time", group = "Log filter", confirm = true)
//@variable The ending time for logs if `filterLogsInput` is `true`.
int logEndInput = input.time(0, "End time", group = "Log filter", confirm = true)

//@variable The RMA of `close` prices.
float rma = ta.rma(close, lengthInput)

//@variable Is `true` when `close` exceeds the `rma`.
bool priceBelow = close <= rma
//@variable Is `true` when the current `close` is greater than the max of the previous `hl2` and `close`.
bool priceRising = close > math.max(hl2[1], close[1])
//@variable Is `true` when the `rma` is positively accelerating.
bool rmaAccelerating = rma - 2.0 * rma[1] + rma[2] > 0.0
//@variable Is `true` when the difference between `rma` and `close` exceeds 2 times the current ATR.
bool closeAtThreshold = rma - close > ta.atr(lengthInput) * 2.0
//@variable Is `true` when all the above conditions occur.
bool compoundCondition = priceBelow and priceRising and rmaAccelerating and closeAtThreshold

// Plot the `rma`.
plot(rma, "RMA", color.teal, 3)
// Highlight the chart background when the `compoundCondition` occurs.
bgcolor(compoundCondition ? color.new(color.aqua, 80) : na, title = "Compound condition highlight")

//@variable If `filterLogsInput` is `true`, is only `true` in the input time range. Otherwise, always `true`.
bool showLog = filterLogsInput ? time >= logStartInput and time <= logEndInput : true

// Log results for a confirmed bar when `showLog` is `true`.
if barstate.isconfirmed and showLog
    log.info(
         "\nclose: {0, number, #.#####}\nrma: {1, number, #.#####}\npriceBelow: {2}\npriceRising: {3}
         \nrmaAccelerating: {4}\ncloseAtThreshold: {5}\n\ncompoundCondition: {6}",
         close, rma, priceBelow, priceRising, rmaAccelerating, closeAtThreshold, compoundCondition
     )
注意:
input.*()分配给 、 和 变量的函数filterLogsInput包括logStartInput一个参数logEndInput,group用于在脚本的设置中组织和区分它们。- 包含input.time
()
调用
confirm = true,以便我们可以在图表上直接以交互方式设置开始和结束时间。要重置输入,请从脚本的“更多”菜单的选项中选择“重置点…”。 - 触发每个log.info()调用的条件 包括 barstate.isconfirmed ,以将日志生成限制为已确认的条形图。
调试功能
用户定义函数和 方法 是由用户编写的自定义函数。它们封装了脚本稍后可调用的操作序列。
每个 用户定义的函数或 方法 都有一个嵌入到脚本全局作用域中的 局部作用域。函数签名中的参数和函数主体内声明的变量属于该函数的局部作用域,脚本的外部作用域或其他函数的作用域无法直接访问它们。
以下部分解释了程序员可以从函数的本地范围调试值的几种方法。我们将使用此脚本作为后续示例的起点。它包含一个函数,该函数返回指数移动平均线,其平滑参数根据条形图
上第25 和第 75 个
百分位数customMA()之外的距离而变化:sourcelength
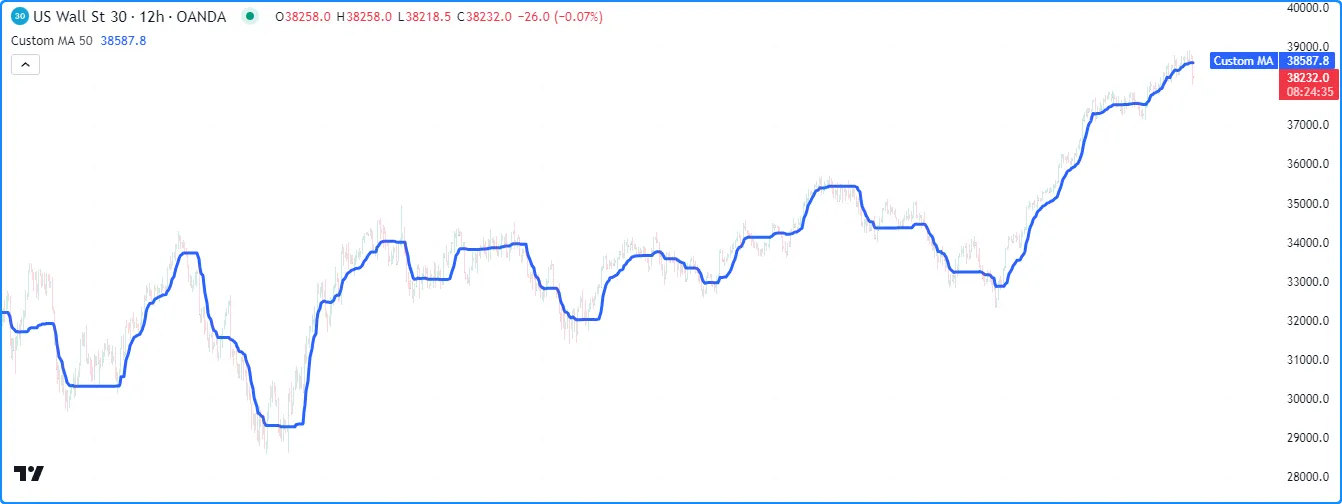
//@version=5
indicator("Debugging functions demo", "Custom MA", true)

//@variable The number of bars in the `customMA()` calculation.
int lengthInput = input.int(50, "Length", 2)

//@function      Calculates a moving average that only responds to values outside the first and third quartiles.
//@param source  The series of values to process.
//@param length  The number of bars in the calculation.
//@returns       The moving average value.
customMA(float source, int length) =>
    //@variable The custom moving average.
    var float result = na
    // Calculate the 25th and 75th `source` percentiles.
    float q1 = ta.percentile_linear_interpolation(source, length, 25)
    float q3 = ta.percentile_linear_interpolation(source, length, 75)
    // Calculate the range values.
    float outerRange = math.max(source - q3, q1 - source, 0.0)
    float totalRange = ta.range(source, length)
    //@variable Half the ratio of the `outerRange` to the `totalRange`.
    float alpha = 0.5 * outerRange / totalRange
    // Mix the `source` with the `result` based on the `alpha` value.
    result := (1.0 - alpha) * nz(result, source) + alpha * source
    // Return the `result`.
    result

//@variable The `customMA()` result over `lengthInput` bars.
float maValue = customMA(close, lengthInput)

// Plot the `maValue`.
plot(maValue, "Custom MA", color.blue, 3)
提取局部变量
当程序员想要 通过 绘制其值、 为背景或图表条着色等方式检查用户定义函数的局部变量时,他们必须将值提取到全局范围,因为产生此类输出的内置函数只能接受全局变量和文字。
由于函数返回的值在发生调用的范围中可用,因此一种直接的提取方法是让函数返回一个包含所有需要检查的值的元组。
在这里,我们修改了customMA()函数以返回
包含函数所有计算变量的元组。现在,我们可以使用元组声明调用该函数,以使值在全局范围内可用,并使用
plots检查它们:
//@version=5
indicator("Extracting local variables with tuples demo", "Custom MA", true)
//@variable The number of bars in the `customMA()` calculation.
int lengthInput = input.int(50, "Length", 2)
//@function Calculates a moving average that only responds to values outside the first and third quartiles.
//@param source The series of values to process.
//@param length The number of bars in the calculation.
//@returns The moving average value.
customMA(float source, int length) =>
//@variable The custom moving average.
var float result = na
// Calculate the 25th and 75th `source` percentiles.
float q1 = ta.percentile_linear_interpolation(source, length, 25)
float q3 = ta.percentile_linear_interpolation(source, length, 75)
// Calculate the range values.
float outerRange = math.max(source - q3, q1 - source, 0.0)
float totalRange = ta.range(source, length)
//@variable Half the ratio of the `outerRange` to the `totalRange`.
float alpha = 0.5 * outerRange / totalRange
// Mix the `source` with the `result` based on the `alpha` value.
result := (1.0 - alpha) * nz(result, source) + alpha * source
// Return a tuple containing the `result` and other local variables.
[result, q1, q3, outerRange, totalRange, alpha]
// Declare a tuple containing all values returned by `customMA()`.
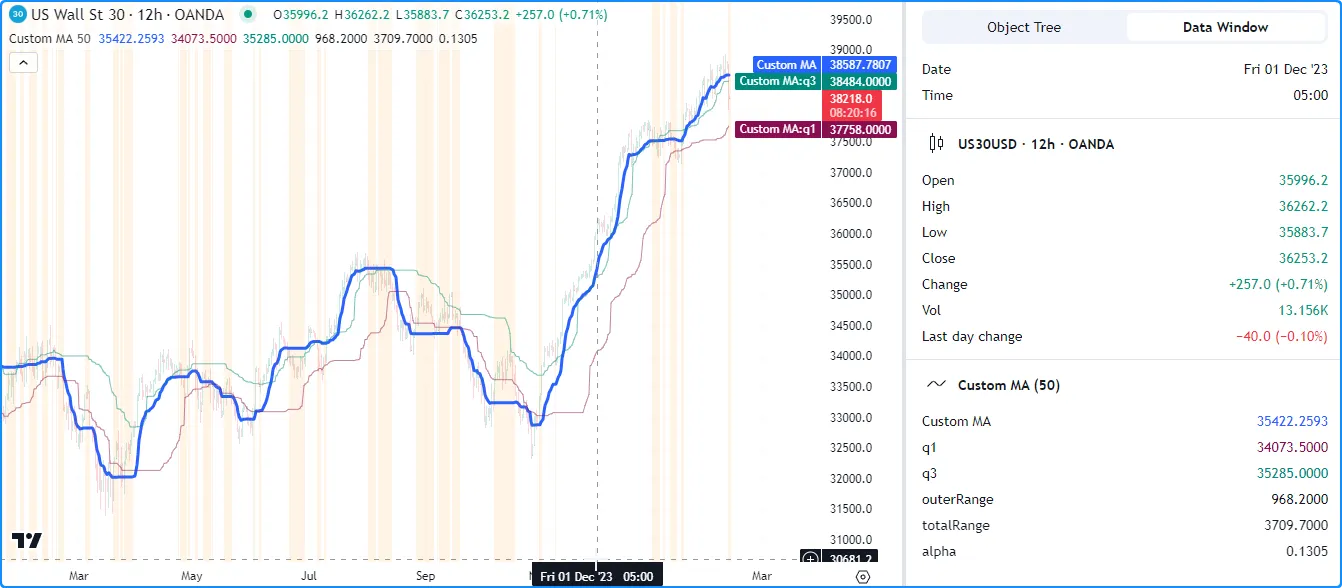
[maValue, q1Debug, q3Debug, outerRangeDebug, totalRangeDebug, alphaDebug] = customMA(close, lengthInput)
// Plot the `maValue`.
plot(maValue, "Custom MA", color.blue, 3)
//@variable Display location for plots with different scale.
notOnPane = display.all - display.pane
// Display the extracted `q1` and `q3` values in all plot locations.
plot(q1Debug, "q1", color.new(color.maroon, 50))
plot(q3Debug, "q3", color.new(color.teal, 50))
// Display the other extracted values in the status line and Data Window to avoid impacting the scale.
plot(outerRangeDebug, "outerRange", chart.fg_color, display = notOnPane)
plot(totalRangeDebug, "totalRange", chart.fg_color, display = notOnPane)
plot(alphaDebug, "alpha", chart.fg_color, display = notOnPane)
// Highlight the chart when `alphaDebug` is 0, i.e., when the `maValue` does not change.
bgcolor(alphaDebug == 0.0 ? color.new(color.orange, 90) : na, title = "`alpha == 0.0` highlight")
注意:
- 我们使用来绘制、和变量
display.all - display.pane的图, 以避免影响图表的比例。outerRangeDebugtotalRangeDebugalphaDebug - 该脚本还使用
条件颜色
在为 0时突出显示图表窗格的
背景,表示不会发生变化。
debugAlphamaValue
提取函数局部变量值的另一种更高级的方法是将它们传递给全局范围内声明的引用类型变量。
函数作用域可以访问全局变量以进行计算。虽然脚本无法直接从函数作用域内重新分配全局变量的值,但如果它们是引用类型(例如 数组、 矩阵、 映射和 用户定义类型) ,则可以更新这些值的元素或属性。
此版本debugData在全局范围内声明一个变量,该变量引用
具有“字符串”键和“浮点”值的
映射customMA()。在函数的本地范围内,脚本将包含每个本地变量的名称和值的键值对放入映射中。调用函数后,脚本绘制存储的debugData值:
//@version=5
indicator("Extracting local variables with reference types demo", "Custom MA", true)

//@variable The number of bars in the `customMA()` calculation.
int lengthInput = input.int(50, "Length", 2)

//@variable A map with "string" keys and "float" values for debugging the `customMA()`.
map<string, float> debugData = map.new<string, float>()

//@function      Calculates a moving average that only responds to values outside the first and third quartiles.
//@param source  The series of values to process.
//@param length  The number of bars in the calculation.
//@returns       The moving average value.
customMA(float source, int length) =>
    //@variable The custom moving average.
    var float result = na
    // Calculate the 25th and 75th `source` percentiles.
    float q1 = ta.percentile_linear_interpolation(source, length, 25),    map.put(debugData, "q1", q1)
    float q3 = ta.percentile_linear_interpolation(source, length, 75),    map.put(debugData, "q3", q3)
    // Calculate the range values.
    float outerRange = math.max(source - q3, q1 - source, 0.0),           map.put(debugData, "outerRange", outerRange)
    float totalRange = ta.range(source, length),                          map.put(debugData, "totalRange", totalRange)
    //@variable Half the ratio of the `outerRange` to the `totalRange`.
    float alpha = 0.5 * outerRange / totalRange,                          map.put(debugData, "alpha", alpha)
    // Mix the `source` with the `result` based on the `alpha` value.
    result := (1.0 - alpha) * nz(result, source) + alpha * source
    // Return the `result`.
    result

//@variable The `customMA()` result over `lengthInput` bars.
float maValue = customMA(close, lengthInput)

// Plot the `maValue`.
plot(maValue, "Custom MA", color.blue, 3)

//@variable Display location for plots with different scale.
notOnPane = display.all - display.pane

// Display the extracted `q1` and `q3` values in all plot locations.
plot(map.get(debugData, "q1"), "q1", color.new(color.maroon, 50))
plot(map.get(debugData, "q3"), "q3", color.new(color.teal, 50))
// Display the other extracted values in the status line and Data Window to avoid impacting the scale.
plot(map.get(debugData, "outerRange"), "outerRange", chart.fg_color, display = notOnPane)
plot(map.get(debugData, "totalRange"), "totalRange", chart.fg_color, display = notOnPane)
plot(map.get(debugData, "alpha"), "alpha", chart.fg_color, display = notOnPane)
// Highlight the chart when the extracted `alpha` is 0, i.e., when the `maValue` does not change.
bgcolor(map.get(debugData, "alpha") == 0.0 ? color.new(color.orange, 90) : na, title = "`alpha == 0.0` highlight")
注意:
- 我们将每个
map.put()
调用放在与每个变量声明相同的行上,用逗号分隔,以保持简洁并避免在
customMA()代码中添加多余的行。 - 我们使用 map.get() 来检索调试 plot() 和 bgcolor() 调用的每个值。
本地图纸和日志
plot.*()与函数和其他需要全局范围可访问的值的函数
不同,脚本可以直接在函数内部生成绘图对象和Pine Logs ,从而允许程序员灵活地调试其局部变量,而无需将值提取到外部范围。
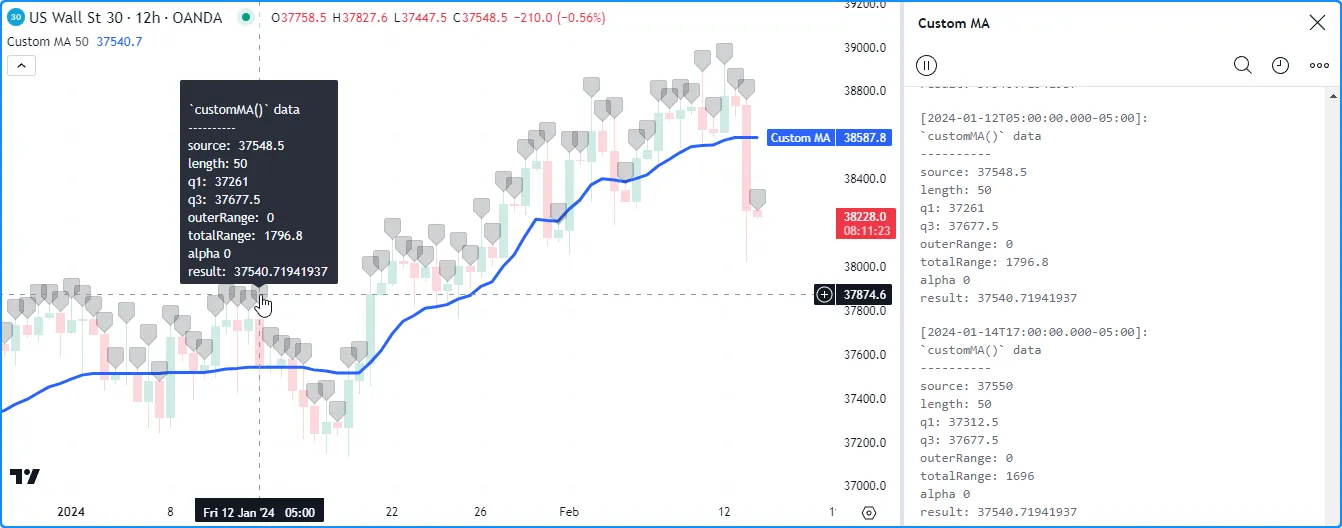
在此示例中,我们使用
标签和
Pine Logs来显示
范围内值的字符串表示形式customMA()。在函数内部,脚本调用
str.format()
来创建表示本地范围数据的格式化字符串,然后调用
label.new()
和
log.info()
分别在工具提示中显示图表上的文本并在
Pine Logs窗格中记录包含文本的“信息”消息:
//@version=5
indicator("Local drawings and logs demo", "Custom MA", true, max_labels_count = 500)

//@variable The number of bars in the `customMA()` calculation.
int lengthInput = input.int(50, "Length", 2)

//@function      Calculates a moving average that only responds to values outside the first and third quartiles.
//@param source  The series of values to process.
//@param length  The number of bars in the calculation.
//@returns       The moving average value.
customMA(float source, int length) =>
    //@variable The custom moving average.
    var float result = na
    // Calculate the 25th and 75th `source` percentiles.
    float q1 = ta.percentile_linear_interpolation(source, length, 25)
    float q3 = ta.percentile_linear_interpolation(source, length, 75)
    // Calculate the range values.
    float outerRange = math.max(source - q3, q1 - source, 0.0)
    float totalRange = ta.range(source, length)
    //@variable Half the ratio of the `outerRange` to the `totalRange`.
    float alpha = 0.5 * outerRange / totalRange
    // Mix the `source` with the `result` based on the `alpha` value.
    result := (1.0 - alpha) * nz(result, source) + alpha * source

    //@variable A formatted string containing representations of all local variables.
    string debugText = str.format(
         "\n`customMA()` data\n----------\nsource: {0, number, #.########}\nlength: {1}\nq1: {2, number, #.########}
         \nq3: {3, number, #.########}\nouterRange: {4, number, #.########}\ntotalRange: {5, number, #.########}
         \nalpha{6, number, #.########}\nresult: {7, number, #.########}",
         source, length, q1, q3, outerRange, totalRange, alpha, result
     )
    // Draw a label with a tooltip displaying the `debugText`.
    label.new(bar_index, high, color = color.new(chart.fg_color, 80), tooltip = debugText)
    // Print an "info" message in the Pine Logs pane when the bar is confirmed.
    if barstate.isconfirmed
        log.info(debugText)

    // Return the `result`.
    result

//@variable The `customMA()` result over `lengthInput` bars.
float maValue = customMA(close, lengthInput)

// Plot the `maValue`.
plot(maValue, "Custom MA", color.blue, 3)
注意:
- 我们
max_labels_count = 500在 indicator() 函数中加入了显示 最近 500 个呼叫的标签customMA()。 - 该函数 在 if语句中使用barstate.isconfirmed 仅 在已确认的条形图 上调用log.info()。它不会在每个实时报价上记录新消息。
调试循环
循环是一种基于计数器 ( for )、集合内容 ( for…in ) 或条件 ( while ) 重复执行代码块的结构。它们允许脚本执行重复任务,而无需冗余的代码行。
每个循环实例都维护一个单独的局部作用域,所有外部作用域都无法访问该作用域。在循环作用域内声明的所有变量都特定于该循环,这意味着不能在外部作用域中使用它们。
与 Pine 中的其他结构一样,循环调试的方法有很多种。本节探讨了一些有用的技巧,包括提取绘图的局部值、使用 绘图检查值以及使用Pine Logs跟踪循环的执行 。
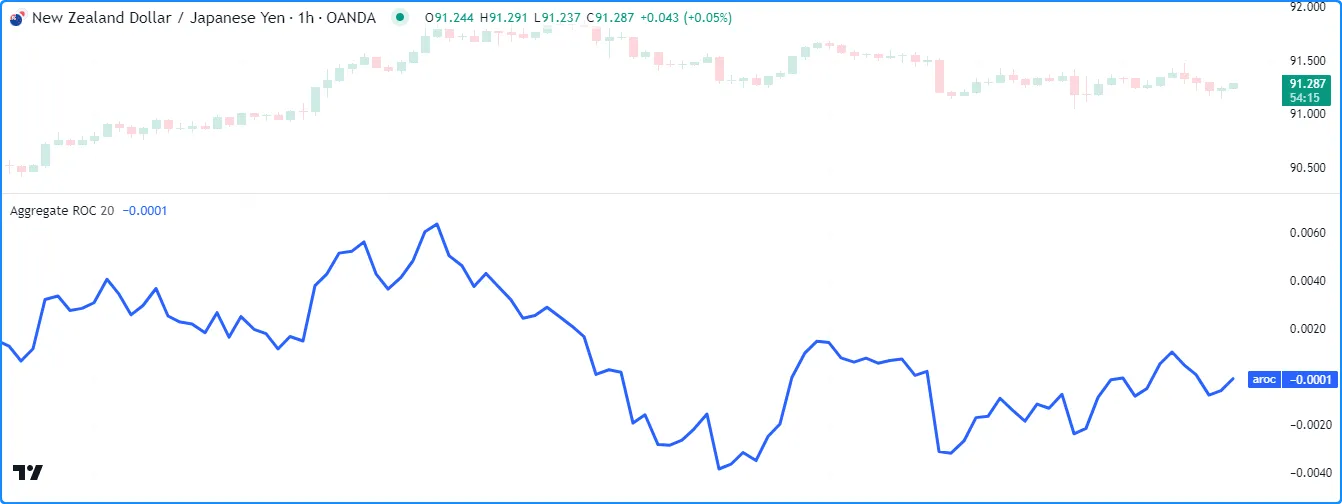
我们将使用此脚本作为以下部分示例的起点。它汇总
1 个条形图的收盘
价变化率,并在forlookbackInput循环中累积它们
,然后将结果除以以计算最终平均值:lookbackInput
//@version=5
indicator("Debugging loops demo", "Aggregate ROC")

//@variable The number of bars in the calculation.
int lookbackInput = input.int(20, "Lookback", 1)

//@variable The average ROC of `close` prices over each length from 1 to `lookbackInput` bars.
float aroc = 0.0

// Calculation loop.
for length = 1 to lookbackInput
    //@variable The `close` value `length` bars ago.
    float pastClose = close[length]
    //@variable The `close` rate of change over `length` bars.
    float roc = (close - pastClose) / pastClose
    // Add the `roc` to `aroc`.
    aroc += roc

// Divide `aroc` by the `lookbackInput`.
aroc /= lookbackInput

// Plot the `aroc`.
plot(aroc, "aroc", color.blue, 3)
注意:
- 是在循环内修改的全局
aroc变量,而和是外部范围无法访问的局部变量。pastCloseroc
检查单次迭代
当程序员需要专注于特定的循环迭代时,他们可以使用多种技术,其中大多数需要使用 循环内的条件来触发调试操作,例如将值提取到外部变量、创建 图纸、记录消息等。
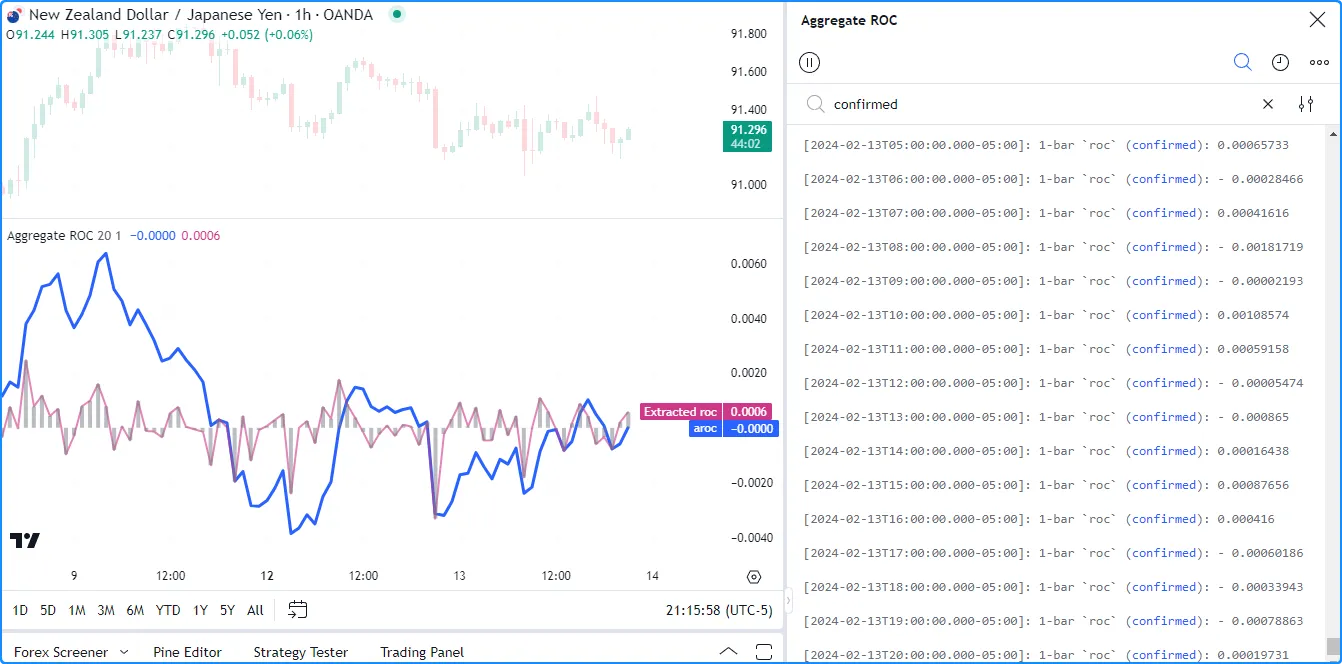
roc此示例以三种不同的方式检查循环单次迭代中的局部值。当循环计数器的值等于时debugCounterInput,脚本将分配roc给rocDebug
全局范围内的变量以进行
绘图,
使用line.new()
从 0 到该值
绘制一条垂直线,并使用log.info()在Pine Logs窗格
中记录一条消息
:roc
//@version=5
indicator("Inspecting a single iteration demo", "Aggregate ROC", max_lines_count = 500)

//@variable The number of bars in the calculation.
int lookbackInput = input.int(20, "Lookback", 1)
//@variable The `length` value in the loop's execution where value extraction occurs.
int debugCounterInput = input.int(1, "Loop counter value", 1, group = "Debugging")

//@variable The `roc` value extracted from the loop.
float rocDebug = na

//@variable The average ROC of `close` over lags from 1 to `lookbackInput` bars.
float aroc = 0.0

// Calculation loop.
for length = 1 to lookbackInput
    //@variable The `close` value `length` bars ago.
    float pastClose = close[length]
    //@variable The `close` rate of change over `length` bars.
    float roc = (close - pastClose) / pastClose
    // Add the `roc` to `aroc`.
    aroc += roc

    // Trigger debug actions when the `length` equals the `debugCounterInput`.
    if length == debugCounterInput
        // Assign `roc` to `rocDebug` so the script can plot its value.
        rocDebug := roc
        // Draw a vertical line from 0 to the `roc` at the `bar_index`.
        line.new(bar_index, 0.0, bar_index, roc, color = color.new(color.gray, 50), width = 4)
        // Log an "info" message in the Pine Logs pane.
        log.info("{0}-bar `roc`{1}: {2, number, #.########}", length, barstate.isconfirmed ? " (confirmed)" : "", roc)

// Divide `aroc` by the `lookbackInput`.
aroc /= lookbackInput

// Plot the `aroc`.
plot(aroc, "aroc", color.blue, 3)

// Plot the `rocDebug`.
plot(rocDebug, "Extracted roc", color.new(color.rgb(206, 55, 136), 40), 2)
注意:
- 分配给的input.int
()
调用
debugCounterInput包含一个group参数,用于在脚本的设置中区分它。 - 每当barstate.isconfirmed
为时, log.info
()
调用都会在格式化消息中包含“(confirmed)”
。在Pine Logs窗格中搜索此文本
将过滤掉未确认条中的条目。请参阅
上面的过滤日志部分。
true
检查多次迭代
当检查来自多个循环迭代的值时,利用 集合或字符串来收集结果以便在循环终止后用于输出函数通常会很有帮助。
此版本演示了几种从所有迭代中收集和显示循环值的方法。它在全局范围内
声明一个logText字符串和一个
数组。在for
循环的本地范围内,脚本将and的字符串表示与
连接起来,并调用
array.push()
将迭代的值推送到数组中。debugValueslengthroclogTextrocdebugValues
循环结束后,脚本
绘制数组
中的第一个
和
最后一个值
debugValues,绘制一个
带有工具提示的标签,显示
数组的
字符串表示形式,并在确认栏后在
Pine Logs窗格中显示:logText
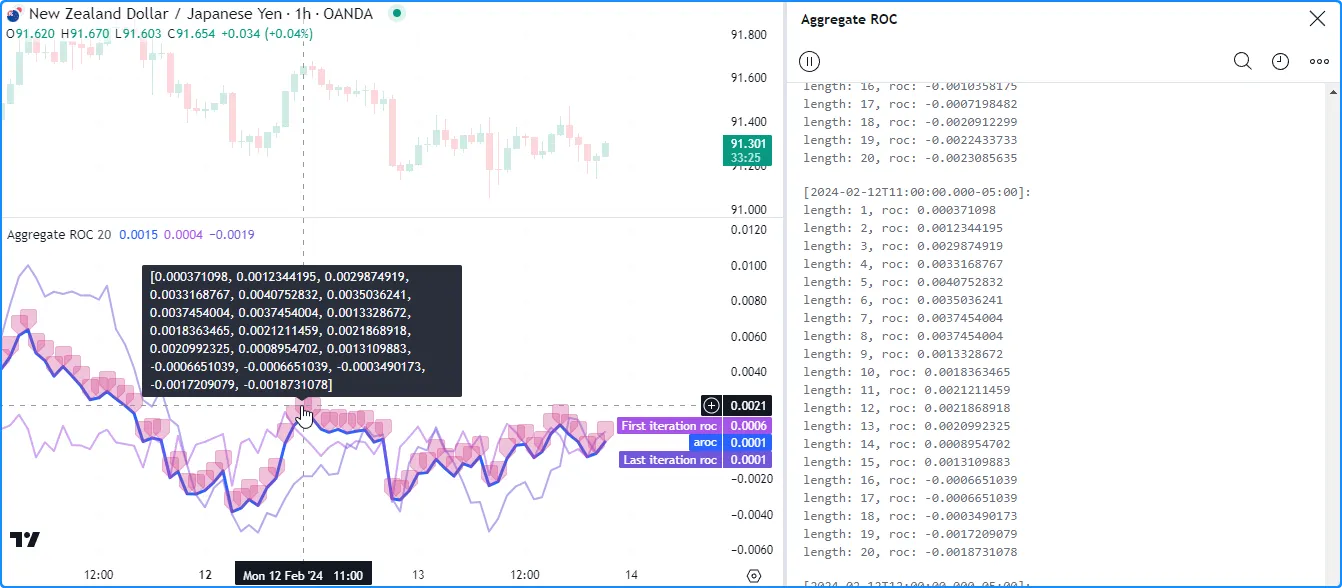
//@version=5
indicator("Inspecting multiple iterations demo", "Aggregate ROC", max_labels_count = 500)

//@variable The number of bars in the calculation.
int lookbackInput = input.int(20, "Lookback", 1)

//@variable An array containing the `roc` value from each loop iteration.
array<float> debugValues = array.new<float>()
//@variable A "string" containing information about the `roc` on each iteration.
string logText = ""

//@variable The average ROC of `close` over lags from 1 to `lookbackInput` bars.
float aroc = 0.0

// Calculation loop.
for length = 1 to lookbackInput
    //@variable The `close` value `length` bars ago.
    float pastClose = close[length]
    //@variable The `close` rate of change over `length` bars.
    float roc = (close - pastClose) / pastClose
    // Add the `roc` to `aroc`.
    aroc += roc

    // Concatenate a new "string" representation with the `debugText`.
    logText += "\nlength: " + str.tostring(length) + ", roc: " + str.tostring(roc)
    // Push the `roc` value into the `debugValues` array.
    array.push(debugValues, roc)

// Divide `aroc` by the `lookbackInput`.
aroc /= lookbackInput

// Plot the `aroc`.
plot(aroc, "aroc", color.blue, 3)

// Plot the `roc` values from the first and last iteration.
plot(array.first(debugValues), "First iteration roc", color.new(color.rgb(166, 84, 233), 50), 2)
plot(array.last(debugValues), "Last iteration roc", color.new(color.rgb(115, 86, 218), 50), 2)
// Draw a label with a tooltip containing a "string" representation of the `debugValues` array.
label.new(bar_index, aroc, color = color.new(color.rgb(206, 55, 136), 70), tooltip = str.tostring(debugValues))
// Log the `logText` in the Pine Logs pane when the bar is confirmed.
if barstate.isconfirmed
    log.info(logText)
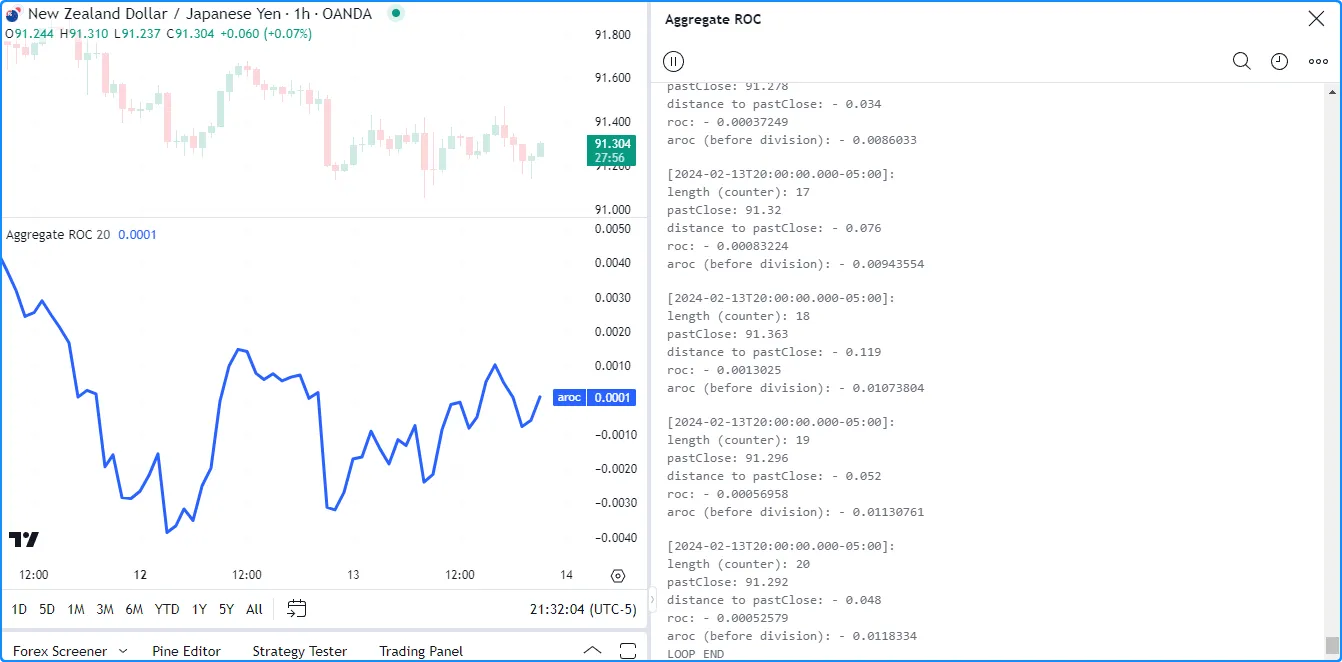
检查多次迭代循环的另一种方法是生成连续的Pine Logs或在循环范围内创建/修改 绘图对象,以详细跟踪其执行模式。
此示例使用Pine Logs来跟踪脚本循环的执行流程。它在每次迭代时都会生成一条新的“信息”消息,以跟踪循环在每个确认的条形图上进行时本地范围的计算:
//@version=5
indicator("Inspecting multiple iterations demo", "Aggregate ROC")

//@variable The number of bars in the calculation.
int lookbackInput = input.int(20, "Lookback", 1)

//@variable The average ROC of `close` over lags from 1 to `lookbackInput` bars.
float aroc = 0.0

// Calculation loop.
for length = 1 to lookbackInput
    //@variable The `close` value `length` bars ago.
    float pastClose = close[length]
    //@variable The `close` rate of change over `length` bars.
    float roc = (close - pastClose) / pastClose
    // Add the `roc` to `aroc`.
    aroc += roc
    if barstate.isconfirmed
        log.info(
             "{0}\nlength (counter): {1}\npastClose: {2, number, #.#####}\n
             distance to pastClose: {3, number, #.########}\nroc: {4, number, #.########}\n
             aroc (before division): {5, number, #.########}\n{6}",
             length == 1 ? "LOOP START" : "",
             length, pastClose, close - pastClose, roc, aroc,
             length == lookbackInput ? "LOOP END" : ""
         )

// Divide `aroc` by the `lookbackInput`.
aroc /= lookbackInput

// Plot the `aroc`.
plot(aroc, "aroc", color.blue, 3)
注意:
- 在循环内部迭代生成 日志或绘图时,务必避免不必要的混乱,并努力实现轻松导航。调试时,数量越多并不总是越好,尤其是在循环内工作时。
提示
组织性和可读性
编写脚本时,明智的做法是优先考虑有条理、易读的源代码。有条理且易读的代码有助于简化调试过程。此外,编写良好的代码随着时间的推移更容易维护。
以下是根据我们的 风格指南和本页示例提供的一些快速提示:
- 尽量遵循一般的 脚本组织建议。使用此结构组织脚本可使查找和检查更加容易。
- 选择易于识别 和理解的变量和函数名称。请参阅 命名约定部分中的一些示例。
- 在调试时,将表达式的重要部分临时分配给具有信息名称的变量通常很有帮助。将表达式分解为可重复使用的部分有助于简化检查过程。
- 使用注释和注解(
//@function、//@variable等)来记录您的代码。注解特别有用,因为当将鼠标悬停在代码中任意位置的变量和函数标识符上时,Pine Editor 的自动建议会在弹出窗口中显示变量和函数描述。 - 请记住,在许多情况下,少即是多。调试时,不要让过多的脚本输出或不必要的信息淹没自己。保持简单,只包含您需要的信息。
加速重复任务
在调试代码时我们经常使用一些方便的技巧:
- 我们使用 plotchar() 或 plotshape() 在脚本的状态行和数据窗口中快速显示“int”、“float”或“bool”变量和表达式的结果。
- 我们经常使用 bgcolor()在图表上直观地展示某些条件 的历史 。
- 我们使用本节
printLabel()中函数 的单行版本在图表末尾打印字符串。 - 我们使用
带有参数的 label.new()
调用来在连续的条形图上的
tooltip工具提示中显示字符串 。 - 我们使用这些函数在Pine Logs窗格中
log.*()快速显示以 字符串表示的数据 。
当人们建立起典型的调试过程时,创建键盘宏通常会有所帮助,以加快重复任务并减少在每个代码中设置调试输出的时间。
以下是一个简单的AutoHotkey脚本(不是Pine Script™ 代码),其中包含上述五种技术的热字符串。该脚本通过输入指定的字符序列后跟空格来生成代码片段:
; ————— This is AHK code, not Pine Script™. —————
; Specify that hotstrings trigger when they end with space, tab, linefeed, or carriage return.#Hotstring EndChars `t `n `r
:X:,,show::SendInput, plotchar(%Clipboard%, "%Clipboard%", "", color = chart.fg_color, display = display.all - display.pane){Enter}:X:,,highlight::SendInput, bgcolor(bool(%Clipboard%) ? color.new(color.orange, 80) : na, title = "%Clipboard% highlight"){Enter}:X:,,print::SendInput, printLabel(string txt, float price = na) => int labelTime = math.max(last_bar_time, chart.right_visible_bar_time), var label result = label.new(labelTime, na, txt, xloc.bar_time, na(price) ? yloc.abovebar : yloc.price, na, label.style_none, chart.fg_color, size.large), label.set_text(result, txt), label.set_y(result, price), result`nprintLabel(){Left}:X:,,tooltip::SendInput, label.new(bar_index, high, color = color.new(chart.fg_color, 70), tooltip = str.tostring(%Clipboard%)){Enter}:X:,,log::SendInput, log.info(str.tostring(%Clipboard%)){Enter}
“,,show” 宏生成一个
plotchar()
调用,该调用使用剪贴板的内容作为series和title
参数。复制variableName变量或close > open
表达式并输入“,,show”后跟一个空格将分别产生:
plotchar(variableName, "variableName", "", color = chart.fg_color, display = display.all - display.pane)
plotchar(close > open, "close > open", "", color = chart.fg_color, display = display.all - display.pane)
“,,highlight” 宏生成一个 bgcolor()调用,该调用根据复制到剪贴板的变量或表达式, 使用条件颜色 突出显示图表窗格的背景 。例如,复制barstate.isrealtime 变量并输入“,,highlight”后跟一个空格将产生:
bgcolor(bool(barstate.isrealtime) ? color.new(color.orange, 80) : na, title = "barstate.isrealtime highlight")
“,,print” 宏生成单行printLabel()函数并创建一个空调printLabel()用,光标放在其中。输入“,,print”后跟一个空格,您需要做的就是输入要显示的文本:
printLabel(string txt, float price = na) => int labelTime = math.max(last_bar_time, chart.right_visible_bar_time), var label result = label.new(labelTime, na, txt, xloc.bar_time, na(price) ? yloc.abovebar : yloc.price, na, label.style_none, chart.fg_color, size.large), label.set_text(result, txt), label.set_y(result, price), result
printLabel()
“,,tooltip” 宏生成一个
label.new()
调用,tooltip其参数使用
str.tostring()
对剪贴板的内容进行操作。复制variableName变量并输入“,,tooltip”后跟一个空格,结果如下:
label.new(bar_index, high, color = color.new(chart.fg_color, 70), tooltip = str.tostring(variableName))
“,,log” 宏生成一个带有
参数的log.info()
调用,message该参数对剪贴板的内容使用
str.tostring()在Pine Logs窗格
中显示变量和表达式的字符串表示形式
。复制表达式bar_index % 2 == 0并输入“,,log”后跟一个空格,结果如下:
log.info(str.tostring(bar_index % 2 == 0))
注意:
- AHK 适用于Windows设备。如果您的设备使用不同的操作系统,请研究其他软件以采用类似的过程。