填充
介绍
Pine Script 的一些可视化输出(包括 plots、 hlines、lines、boxes和 polylines)允许人们用颜色填充它们占据的图表空间。三种不同的机制有助于填充此类输出之间的空间:
- fill()函数 用指定的颜色填充plot()调用中的两个图或hline() 调用中的两条水平线 (hlines) 之间的空间 。
- linefill类型的对象 填充使用line.new()创建的线 实例 之间的空间 。
- 其他绘图类型,即 框和 折线,具有内置属性,允许绘图填充其占据的视觉空间。
`plot()` 和 `hline()`填充
fill () 函数填充两个图或水平线之间的空间。它具有以下两个签名:
fill(plot1, plot2, color, title, editable, show_last, fillgaps) → voidfill(hline1, hline2, color, title, editable, fillgaps) → void、plot1、和plot2参数接受
plot ()
和
hline()
函数调用
返回的
plot
或hline ID。 fill()
函数是唯一可以使用这些 ID 的内置函数。hline1hline2
这个简单的例子演示了
fill()函数如何与plot 和 hline ID
配合使用
。它调用
plot()
和
hline()三次以在图表上显示任意值。每个调用都返回一个 ID,脚本会将该 ID 分配给变量以供fill()函数
使用
。 p1、p2和
的值p3是“plot”ID,而
h1、h2和h3引用“hline”ID:
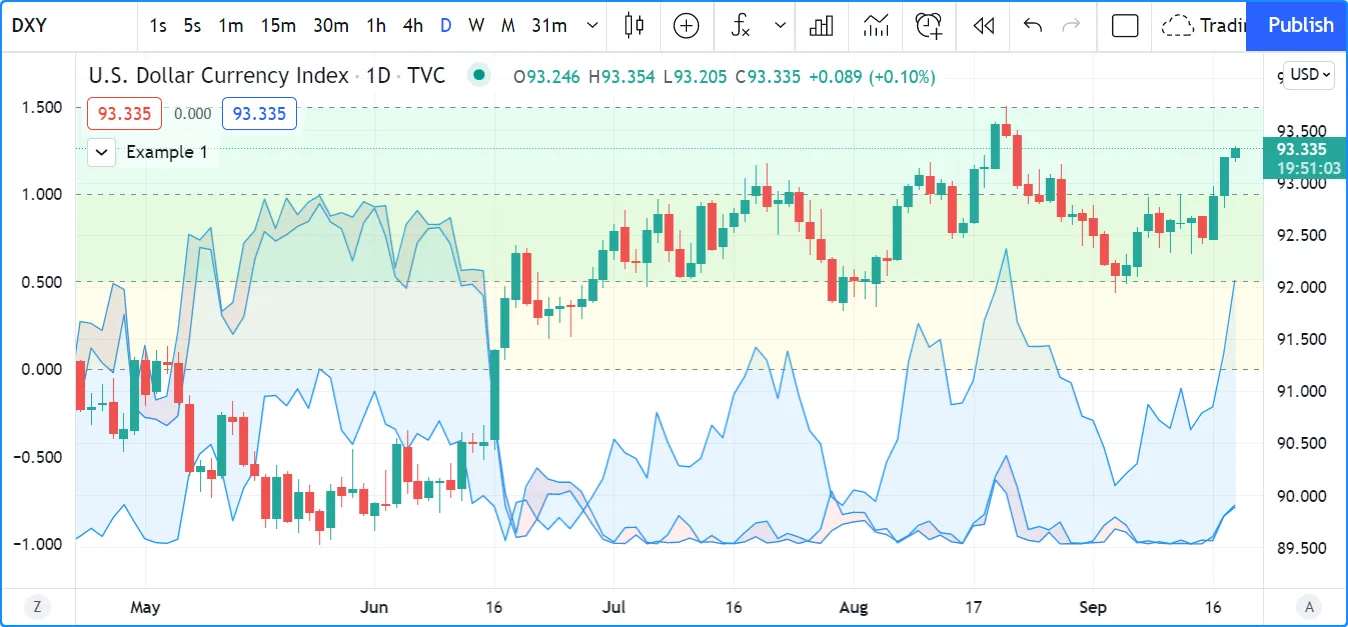
//@version=5
indicator("Example 1")

// Assign "plot" IDs to the `p1`, `p2`, and `p3` variables.
p1 = plot(math.sin(high), "Sine of `high`")
p2 = plot(math.cos(low), "Cosine of `low`")
p3 = plot(math.sin(close), "Sine of `close`")
// Fill the space between `p1` and `p2` with 90% transparent red.
fill(p1, p3, color.new(color.red, 90), "`p1`-`p3` fill")
// Fill the space between `p2` and `p3` with 90% transparent blue.
fill(p2, p3, color.new(color.blue, 90), "`p2`-`p3` fill")

// Assign "hline" IDs to the `h1`, `h2`, and `h3` variables.
h1 = hline(0, "First level")
h2 = hline(1.0, "Second level")
h3 = hline(0.5, "Third level")
h4 = hline(1.5, "Fourth level")
// Fill the space between `h1` and `h2` with 90% transparent yellow.
fill(h1, h2, color.new(color.yellow, 90), "`h1`-`h2` fill")
// Fill the space between `h3` and `h4` with 90% transparent lime.
fill(h3, h4, color.new(color.lime, 90), "`h3`-`h4` fill")
需要注意的是, fill() 函数需要两个“plot”ID 或两个“hline”ID。 在函数调用中不能混合和匹配这些类型。因此, 如果程序员想要填充一致级别和波动系列之间的空白,他们有时需要使用 plot(), 而他们本来可以使用 hline() 。
例如,此脚本oscillator根据图表
收盘
价与 10 条
SMA之间的百分比距离计算,然后将其绘制在图表窗格上。在本例中,我们想要填充与零之间的区域。虽然我们可以使用hline()oscillator显示零水平(
因为它的值不会改变),但我们不能将“plot”和“hline”ID 传递给
fill()
函数。因此,我们必须对水平使用
plot()
调用,以允许脚本填充空间:
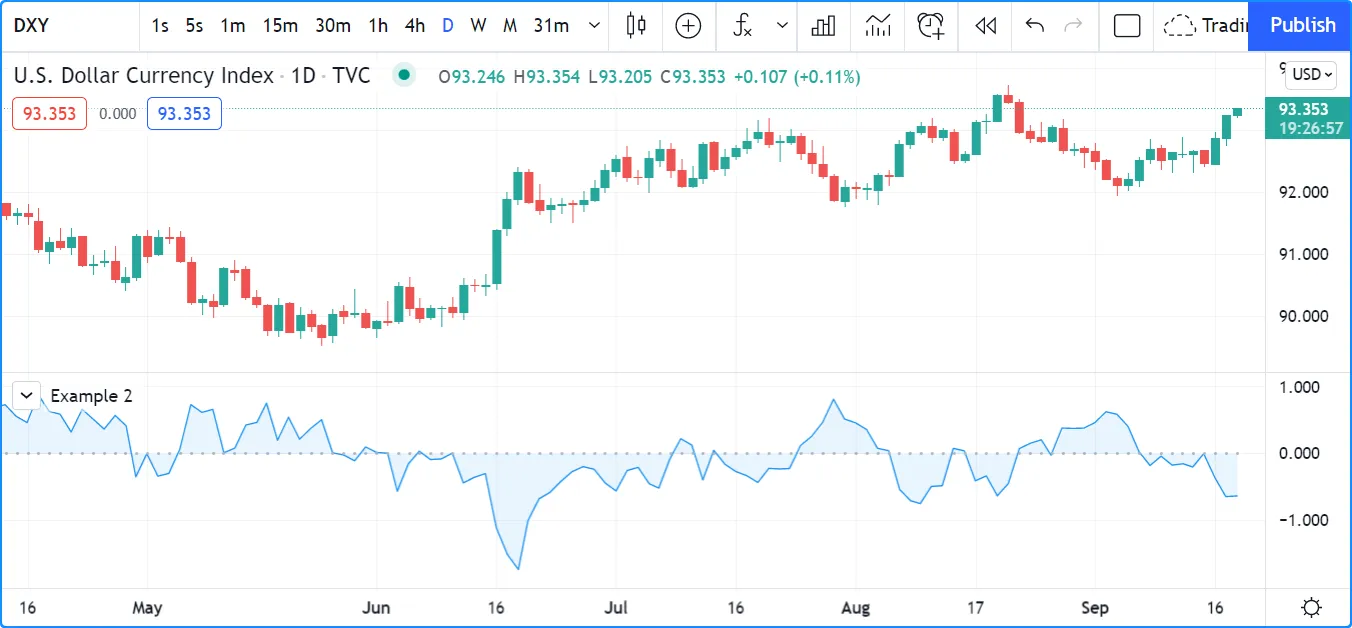
//@version=5
indicator("Example 2")

//@variable The 10-bar moving average of `close` prices.
float ma = ta.sma(close, 10)
//@variable The distance from the `ma` to the `close` price, as a percentage of the `ma`.
float oscillator = 100 * (ma - close) / ma

//@variable The ID of the `oscillator` plot for use in the `fill()` function.
oscPlotID = plot(oscillator, "Oscillator")
//@variable The ID of the zero level plot for use in the `fill()` function.
//          Requires a "plot" ID since the `fill()` function can't use "plot" and "hline" IDs at the same time.
zeroPlotID = plot(0, "Zero level", color.silver, 1, plot.style_circles)

// Filll the space between the `oscPlotID` and `zeroPlotID` with 90% transparent blue.
fill(oscPlotID, zeroPlotID, color.new(color.blue, 90), "Oscillator fill")
fill()color函数的参数
接受
“系列颜色”参数,这意味着填充的颜色可以跨图表条形图更改。例如,此代码根据是否高于,用 90% 透明度的绿色或红色填充两个移动平均线图之间的空间:ma1ma2
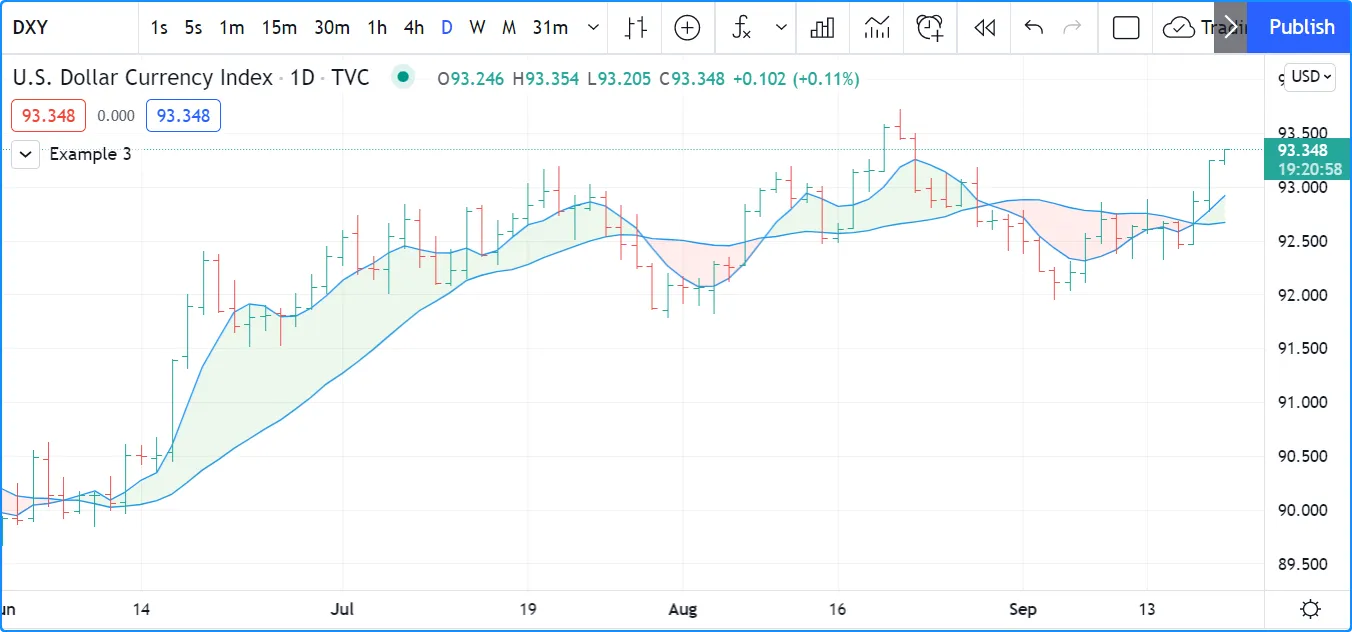
//@version=5
indicator("Example 3", overlay = true)

//@variable The 5-bar moving average of `close` prices.
float ma1 = ta.sma(close, 5)
//@variable The 20-bar moving average of `close` prices.
float ma2 = ta.sma(close, 20)

//@variable The 90% transparent color of the space between MA plots. Green if `ma1 > ma2`, red otherwise.
color fillColor = ma1 > ma2 ? color.new(color.green, 90) : color.new(color.red, 90)

//@variable The ID of the `ma1` plot for use in the `fill()` function.
ma1PlotID = plot(ma1, "5-bar SMA")
//@variable The ID of the `ma2` plot for use in the `fill()` function.
ma2PlotID = plot(ma2, "20-bar SMA")

// Fill the space between the `ma1PlotID` and `ma2PlotID` using the `fillColor`.
fill(ma1PlotID, ma2PlotID, fillColor, "SMA plot fill")
线条填充
虽然 fill() 函数允许脚本填充两个 图或 hlines之间的空间,但它不适用于 line 对象。当脚本需要填充 lines之间的空间时,它需要 由linefill.new()函数 创建的 linefill对象 。该函数具有以下签名:
linefill.new(line1, line2, color) → series linefill和line1参数line2接受
线ID。这些 ID 确定linefill
对象将使用其指定的 填充
的图表区域
color。脚本可以
通过调用linefill.set_color()
并以 ID 作为参数来更新
此函数返回的
linefillcolor ID的属性
。id
行填充的行为取决于它们引用的行。脚本无法直接移动行填充,因为行填充使用的行决定了它将填充的空间。要检索行填充 对象 引用的 行的 ID ,请使用 linefill.get_line1() 和 linefill.get_line2() 函数。
任何一对
线
实例之间只能有一个线
填充。
使用相同的和参数
连续调用
linefill.new()将创建一个新的
线填充
ID,以替换与它们关联的前一个线填充 ID。line1line2
下面的示例演示了线填充的简单用例。脚本使用内置的
ta.pivothigh()
和
ta.pivotlow()
函数以及常量和参数计算 apivotHigh和系列。在最后确认的历史条上,脚本绘制了两条延长线。第一条线连接最近的两个非 na值,第二条线连接最近的非 na值。pivotLowleftbarsrightbarspivotHighpivotLow
为了强调这些线条形成的“通道”,脚本使用linefill.new()填充它们之间的空间 :
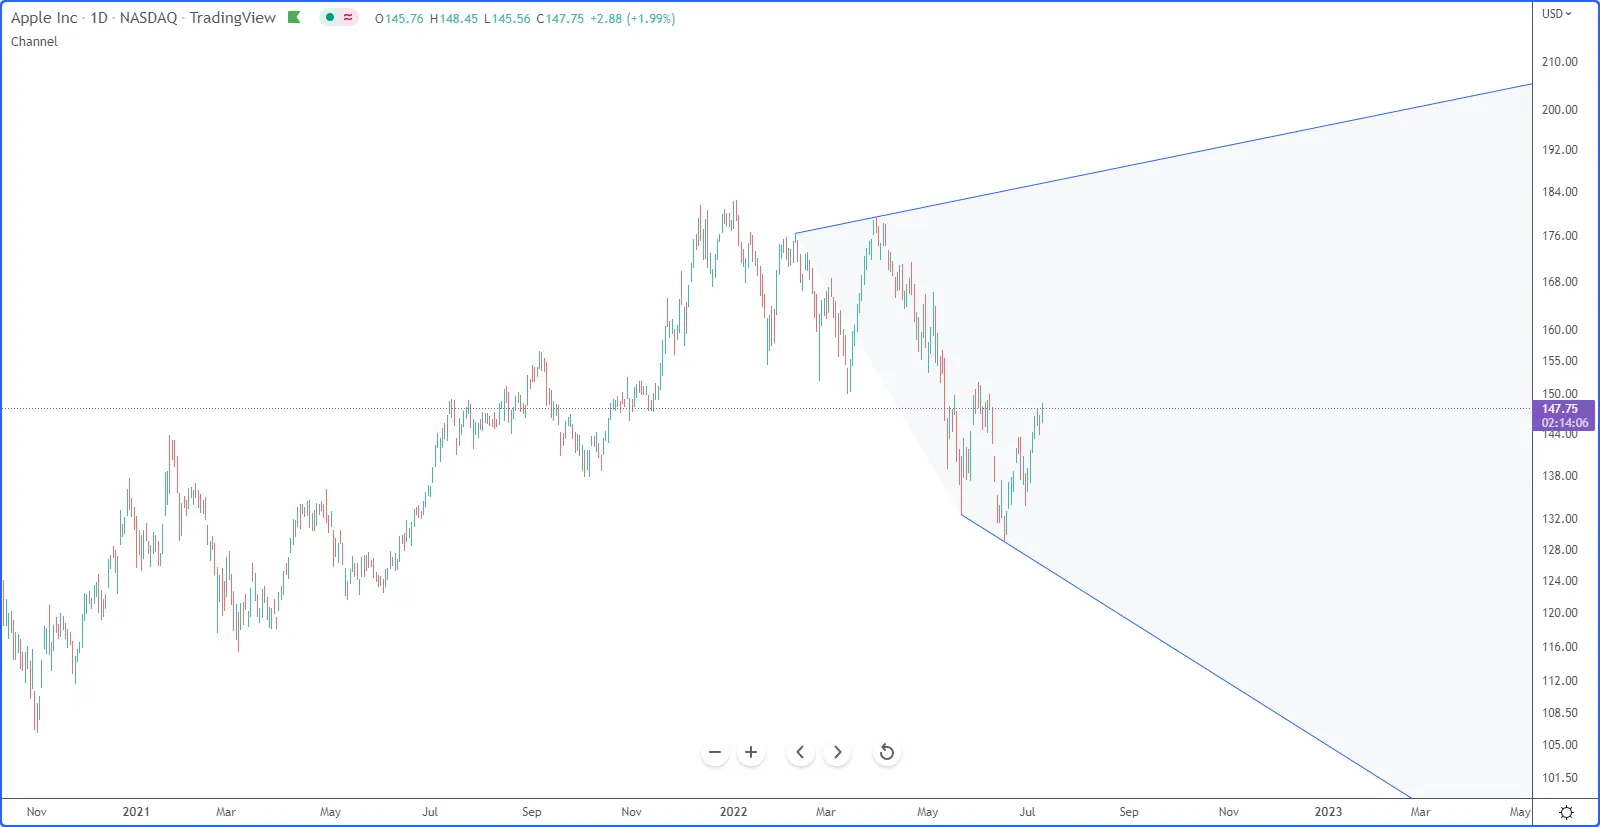
//@version=5
indicator("Linefill demo", "Channel", true)

//@variable The number bars to the left of a detected pivot.
int LEFT_BARS = 15
//@variable The number bars to the right for pivot confirmation.
int RIGHT_BARS = 5

//@variable The price of the pivot high point.
float pivotHigh = ta.pivothigh(LEFT_BARS, RIGHT_BARS)
//@variable The price of the pivot low point.
float pivotLow = ta.pivotlow(LEFT_BARS, RIGHT_BARS)

// Initialize the chart points the lines will use.
var firstHighPoint  = chart.point.new(na, na, na)
var secondHighPoint = chart.point.new(na, na, na)
var firstLowPoint   = chart.point.new(na, na, na)
var secondLowPoint  = chart.point.new(na, na, na)

// Update the `firstHighPoint` and `secondHighPoint` when `pivotHigh` is not `na`.
if not na(pivotHigh)
    firstHighPoint  := secondHighPoint
    secondHighPoint := chart.point.from_index(bar_index - RIGHT_BARS, pivotHigh)
// Update the `firstLowPoint` and `secondLowPoint` when `pivotlow` is not `na`.
if not na(pivotLow)
    firstLowPoint  := secondLowPoint
    secondLowPoint := chart.point.from_index(bar_index - RIGHT_BARS, pivotLow)

if barstate.islastconfirmedhistory
    //@variable An extended line that passes through the `firstHighPoint` and `secondHighPoint`.
    line pivotHighLine = line.new(firstHighPoint, secondHighPoint, extend = extend.right)
    //@variable An extended line that passes through the `firstLowPoint` and `secondLowPoint`.
    line pivotLowLine = line.new(firstLowPoint, secondLowPoint, extend = extend.right)
    //@variable The color of the space between the lines.
    color fillColor = switch
        secondHighPoint.price > firstHighPoint.price and secondLowPoint.price > firstLowPoint.price => color.lime
        secondHighPoint.price < firstHighPoint.price and secondLowPoint.price < firstLowPoint.price => color.red
        =>                                                                                             color.silver
    //@variable A linefill that colors the space between the `pivotHighLine` and `pivotLowLine`.
    linefill channelFill = linefill.new(pivotHighLine, pivotLowLine, color.new(fillColor, 90))
框和折线填充
框 和 折线 类型允许脚本在图表上绘制几何形状和其他图形。脚本 使用 box.new() 和 polyline.new ( )函数创建框和 折线 ,这些函数包含允许绘图填充其可视空间的参数。
要用指定的颜色填充框边框内的空间
,请在box.new()bgcolor函数中包含一个参数
。要填充折线的可视空间,请将一个
参数传递给
polyline.new()
函数。fill_color
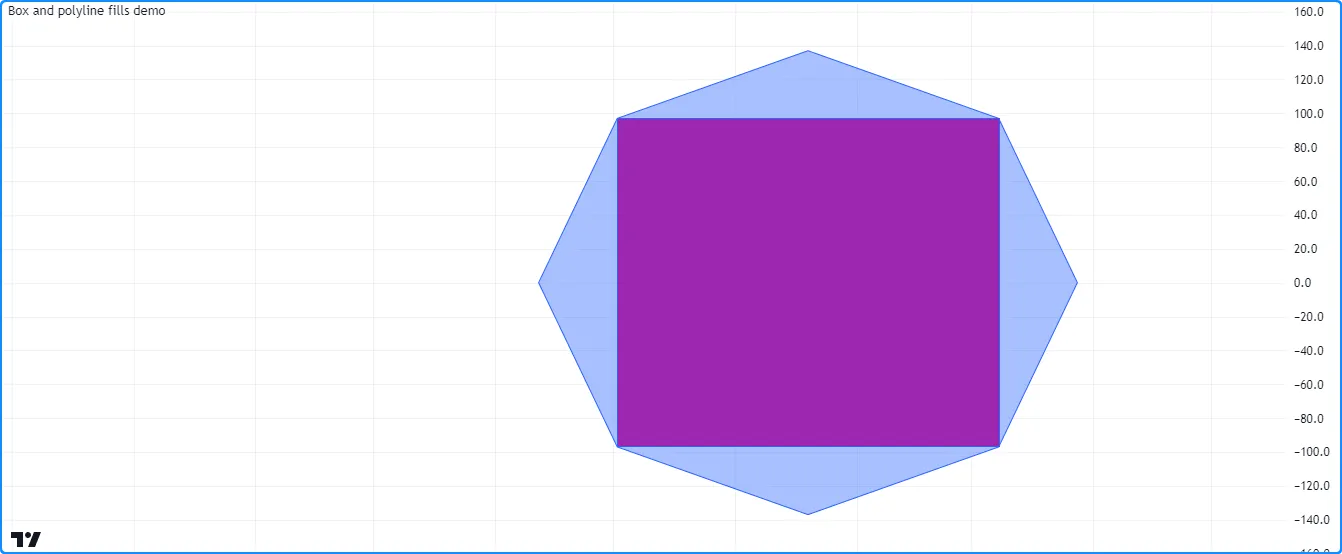
例如,此脚本
在最后确认的历史条上绘制一个带有折线的八边形
和一个带有
框radius的内接矩形。它使用变量中的值确定绘图的大小,该值对应于图表上可见条形数量的大约四分之一。我们fill_color = color.new(color.blue, 60)在
polyline.new()调用中包含了
用半透明蓝色填充八边形的内容,并
bgcolor = color.purple在
box.new()
调用中使用不透明紫色填充内接矩形:
//@version=5
indicator("Box and polyline fills demo")

//@variable The number of visible chart bars, excluding the leftmost and rightmost bars.
var int barCount = 0
if time > chart.left_visible_bar_time and time < chart.right_visible_bar_time
    barCount += 1

//@variable The approximate radius used to calculate the octagon and rectangle coordinates.
int radius = math.ceil(barCount / 4)

if barstate.islastconfirmedhistory
    //@variable An array of chart points. The polyline uses all points in this array, but the box only needs two.
    array<chart.point> points = array.new<chart.point>()
    //@variable The counterclockwise angle of each point, in radians. Updates on each loop iteration.
    float angle = 0.0
    //@variable The radians to add to the `angle` on each loop iteration.
    float increment = 0.25 * math.pi
    // Loop 8 times to calculate octagonal points.
    for i = 0 to 7
        //@variable The point's x-coordinate (bar offset).
        int x = int(math.round(math.cos(angle) * radius))
        //@variable The point's y-coordinate.
        float y = math.round(math.sin(angle) * radius)
        // Push a new chart point into the `points` array and increase the `angle`.
        points.push(chart.point.from_index(bar_index - radius + x, y))
        angle += increment
    // Create a closed polyline to draw the octagon and fill it with translucent blue.
    polyline.new(points, closed = true, fill_color = color.new(color.blue, 60))
    // Create a box for the rectangle using index 3 and 7 for the top-left and bottom-right corners,
    // and fill it with opaque purple.
    box.new(points.get(3), points.get(7), bgcolor = color.purple)
请参阅本手册的 线条和框页面来了解有关使用这些类型的更多信息。