矩阵
介绍
Pine Script™ 矩阵是 :ref:集合,以矩形格式存储值引用。它们相当于二维数组对象,具有用于检查、修改和专门计算的函数和方法。与数组一样,所有矩阵元素必须是同一类型、用户定义类型或枚举类型。
矩阵使用两个索引引用其元素:一个索引用于 行,另一个索引用于列。每个索引从 0 开始,延伸到矩阵中的行数/列数减一。Pine 中的矩阵可以具有动态的行数和列数,这些行数和列数随条形图的不同而变化。 矩阵中的元素总数是行数 和 列数的 乘积 (例如,5x5 矩阵总共有 25 个)。与 数组一样,矩阵中的元素总数不能超过 100,000。
声明矩阵
Pine Script™ 使用以下语法进行矩阵声明:
[var/varip ][matrix<type> ]<identifier> = <expression>其中<type>是
矩阵的类型模板<expression>,用于声明它将包含的值的类型,并且返回类型的矩阵实例或na。
当将矩阵变量声明为时,用户必须通过包含矩阵
关键字和
类型模板na来指定标识符将引用特定类型的矩阵
。
此行声明了一个新myMatrix变量,其值为na。它明确将变量声明为matrix<float>,这告诉编译器该变量只能接受
包含浮点值的矩阵
对象
:
matrix<float> myMatrix = na
当矩阵变量未分配给时na,
矩阵
关键字及其类型模板是可选的,因为编译器将使用变量引用的对象的类型信息。
在这里,我们声明一个引用
具有两行、两列和一个0 的myMatrix新实例的变量。在这种情况下,变量从新对象获取其类型信息,因此它不需要显式的类型声明:matrix<float>initial_value
myMatrix = matrix.new<float>(2, 2, 0.0)
使用 `var` 和 `varip`关键字
与其他变量一样,用户可以包含 var或 varip 关键字,以指示脚本仅声明一次矩阵变量,而不是在每个条形图上都声明一次。使用此关键字声明的矩阵变量将指向图表整个范围内的同一实例,除非脚本明确为其分配另一个矩阵,从而允许矩阵及其元素引用在脚本迭代之间持续存在。
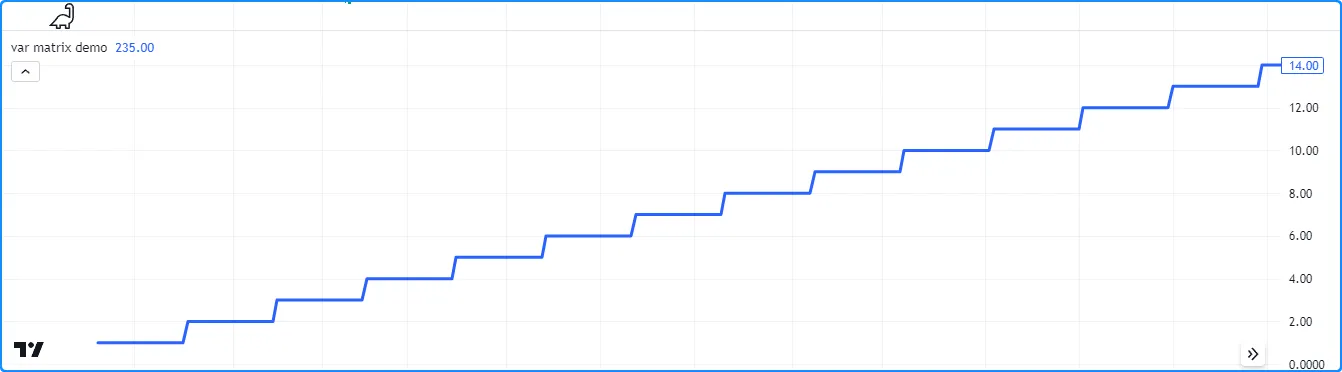
此脚本
使用
varm关键字声明一个分配给矩阵的变量,该矩阵包含一行两个
int元素
。每 20 个条形图,脚本都会将 1 添加到矩阵第一行的第一个元素。plot
()
调用会在图表上显示此元素。从图中可以看出,m.get(0, 0)的值
在条形图之间保持不变,永远不会返回到初始值 0:m
//@version=5
indicator("var matrix demo")

//@variable A 1x2 rectangular matrix declared only at `bar_index == 0`, i.e., the first bar.
var m = matrix.new<int>(1, 2, 0)

//@variable Is `true` on every 20th bar.
bool update = bar_index % 20 == 0

if update
    int currentValue = m.get(0, 0) // Get the current value of the first row and column.
    m.set(0, 0, currentValue + 1)  // Set the first row and column element value to `currentValue + 1`.

plot(m.get(0, 0), linewidth = 3) // Plot the value from the first row and column.
读取和写入矩阵元素
`matrix.get()` 和`matrix.set()`
row要从指定索引处的矩阵中检索值column
,请使用
matrix.get()。此函数定位指定的矩阵元素并返回其值。同样,要覆盖特定元素的值,请使用
matrix.set()
将指定索引处的元素分配给新
row的。columnvalue
下面的示例定义了一个方阵,该矩阵m有两行和两列,initial_value第一条柱上的所有元素均为 0。该脚本使用
m.get()
和
m.set()
方法将不同柱上每个元素的值加 1。它每 11 条柱更新一次第一行的第一个值,每 7 条柱更新一次第一行的第二个值,每 5 条柱更新一次第二行的第一个值,每 3 条柱更新一次第二行的第二个值。该脚本在图表上绘制每个元素的值:
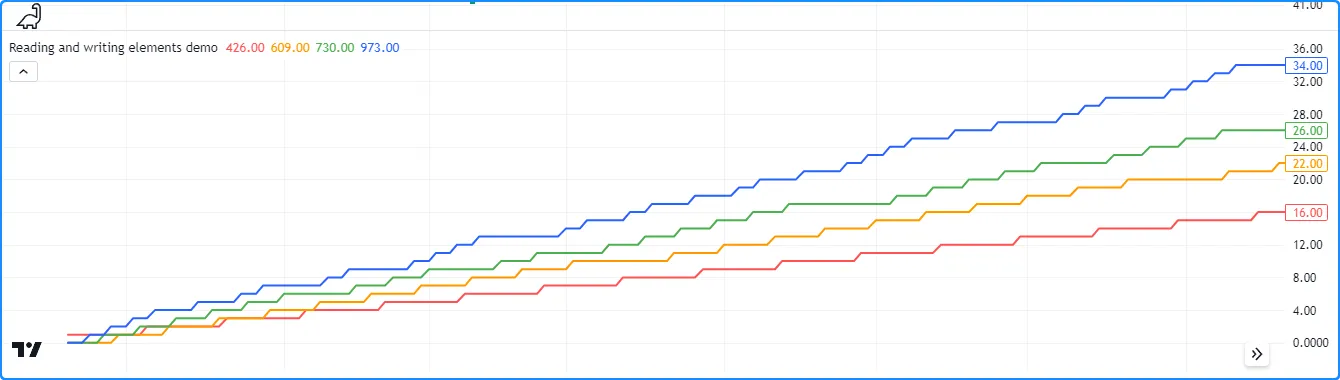
//@version=5
indicator("Reading and writing elements demo")

//@variable A 2x2 square matrix of `float` values.
var m = matrix.new<float>(2, 2, 0.0)

switch
    bar_index % 11 == 0 => m.set(0, 0, m.get(0, 0) + 1.0) // Adds 1 to the value at row 0, column 0 every 11th bar.
    bar_index % 7  == 0 => m.set(0, 1, m.get(0, 1) + 1.0) // Adds 1 to the value at row 0, column 1 every 7th bar.
    bar_index % 5  == 0 => m.set(1, 0, m.get(1, 0) + 1.0) // Adds 1 to the value at row 1, column 0 every 5th bar.
    bar_index % 3  == 0 => m.set(1, 1, m.get(1, 1) + 1.0) // Adds 1 to the value at row 1, column 1 every 3rd bar.

plot(m.get(0, 0), "Row 0, Column 0 Value", color.red, 2)
plot(m.get(0, 1), "Row 0, Column 1 Value", color.orange, 2)
plot(m.get(1, 0), "Row 1, Column 0 Value", color.green, 2)
plot(m.get(1, 1), "Row 1, Column 1 Value", color.blue, 2)
`矩阵.fill()`
要用特定值覆盖所有矩阵元素,请使用
matrix.fill()。此函数将整个矩阵或索引范围内的所有项目
from_row/column指向
调用中指定的
to_row/column值。例如,此代码片段声明一个 4x4 方阵,然后用随机
值填充其元素:value
myMatrix = matrix.new<float>(4, 4)
myMatrix.fill(math.random())
请注意,当将matrix.fill()与包含特殊类型( line、 linefill、 box、 polyline、 label、 table或 chart.point)或UDT 的 矩阵一起使用时 ,所有替换的元素都将指向函数调用中传递的同一对象。
此脚本声明一个包含四行四列标签引用的矩阵,并
在第一个条形图上用新标签对象
填充
该矩阵。在每个条形图上,脚本将x第 0 行第 0 列引用的标签的属性设置为
bar_index,将text第 3 行第 3 列引用的标签的属性设置为图表上的标签数量。虽然矩阵可以引用 16 个 (4x4) 标签,但每个元素都指向同一个实例,因此图表上只有一个标签会更新其每个条形图上的属性x:text
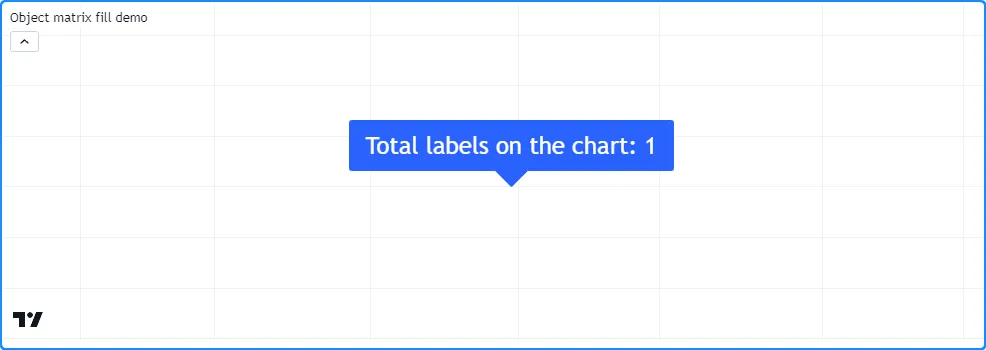
//@version=5
indicator("Object matrix fill demo")

//@variable A 4x4 label matrix.
var matrix<label> m = matrix.new<label>(4, 4)

// Fill `m` with a new label object on the first bar.
if bar_index == 0
    m.fill(label.new(0, 0, textcolor = color.white, size = size.huge))

//@variable The number of label objects on the chart.
int numLabels = label.all.size()

// Set the `x` of the label from the first row and column to `bar_index`.
m.get(0, 0).set_x(bar_index)
// Set the `text` of the label at the last row and column to the number of labels.
m.get(3, 3).set_text(str.format("Total labels on the chart: {0}", numLabels))
行和列
检索
矩阵通过matrix.row() 和 matrix.col()函数方便地检索特定行或列中的所有值 。这些函数将值返回为一个 数组 对象,该数组对象的大小根据矩阵的另一个维度确定,即 matrix.row() 数组的大小等于列数, matrix.col()数组 的大小 等于行数。
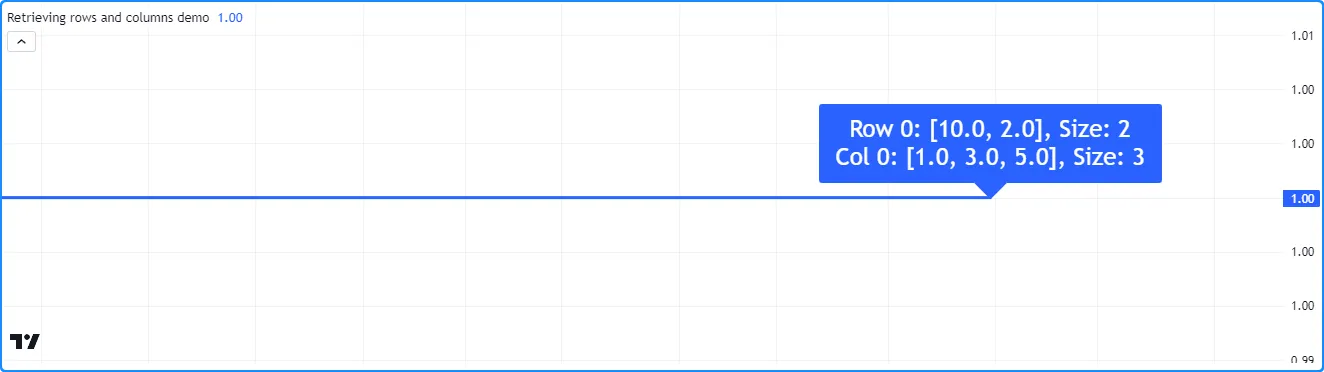
下面的脚本m在第一个图表条上用值 1 - 6 填充一个 3x2 矩阵。它调用
m.row()
和
m.col()
方法来访问矩阵中的第一行和第一列数组,并将它们连同数组大小一起显示在图表的标签中:
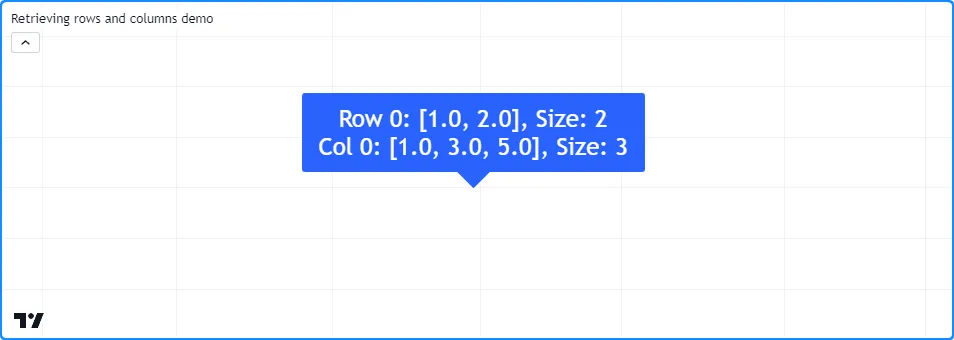
//@version=5
indicator("Retrieving rows and columns demo")

//@variable A 3x2 rectangular matrix.
var matrix<float> m = matrix.new<float>(3, 2)

if bar_index == 0
    m.set(0, 0, 1.0) // Set row 0, column 0 value to 1.
    m.set(0, 1, 2.0) // Set row 0, column 1 value to 2.
    m.set(1, 0, 3.0) // Set row 1, column 0 value to 3.
    m.set(1, 1, 4.0) // Set row 1, column 1 value to 4.
    m.set(2, 0, 5.0) // Set row 1, column 0 value to 5.
    m.set(2, 1, 6.0) // Set row 1, column 1 value to 6.

//@variable The first row of the matrix.
array<float> row0 = m.row(0)
//@variable The first column of the matrix.
array<float> column0 = m.col(0)

//@variable Displays the first row and column of the matrix and their sizes in a label.
var label debugLabel = label.new(0, 0, color = color.blue, textcolor = color.white, size = size.huge)
debugLabel.set_x(bar_index)
debugLabel.set_text(str.format("Row 0: {0}, Size: {1}\nCol 0: {2}, Size: {3}", row0, m.columns(), column0, m.rows()))
注意:
- 为了获取标签中显示的数组的大小,我们使用了
rows()
和
columns()
方法而不是
array.size()
来表明数组的大小
row0等于列数,数组的大小column0等于行数。
matrix.row() 和 matrix.col() 将行/列中的引用复制到新 数组。对这些函数返回的数组的修改 不会直接影响矩阵的元素或形状。
在这里,我们修改了之前的脚本,在
显示标签之前row0通过
array.set()row0方法将第一个元素设置为 10。此脚本还绘制了从第 0 行、第 0 列开始的值。如我们所见,标签显示数组的第一个元素是 10。但是,
绘图
显示相应的矩阵元素仍具有 1 的值:
//@version=5
indicator("Retrieving rows and columns demo")

//@variable A 3x2 rectangular matrix.
var matrix<float> m = matrix.new<float>(3, 2)

if bar_index == 0
    m.set(0, 0, 1.0) // Set row 0, column 0 value to 1.
    m.set(0, 1, 2.0) // Set row 0, column 1 value to 2.
    m.set(1, 0, 3.0) // Set row 1, column 0 value to 3.
    m.set(1, 1, 4.0) // Set row 1, column 1 value to 4.
    m.set(2, 0, 5.0) // Set row 1, column 0 value to 5.
    m.set(2, 1, 6.0) // Set row 1, column 1 value to 6.

//@variable The first row of the matrix.
array<float> row0 = m.row(0)
//@variable The first column of the matrix.
array<float> column0 = m.col(0)

// Set the first `row` element to 10.
row0.set(0, 10)

//@variable Displays the first row and column of the matrix and their sizes in a label.
var label debugLabel = label.new(0, m.get(0, 0), color = color.blue, textcolor = color.white, size = size.huge)
debugLabel.set_x(bar_index)
debugLabel.set_text(str.format("Row 0: {0}, Size: {1}\nCol 0: {2}, Size: {3}", row0, m.columns(), column0, m.rows()))

// Plot the first element of `m`.
plot(m.get(0, 0), linewidth = 3)
虽然对 matrix.row() 或 matrix.col()返回的数组的更改 不会直接影响父矩阵,但需要注意的是,包含 UDT 或特殊类型(包括 line、 linefill、 box、 polyline、 label、 table或 chart.point)的矩阵所得到的数组表现为行/列的浅表副本,即,这些函数返回的数组中的元素指向与相应矩阵元素相同的对象。
此脚本包含一个自定义myUDT类型,其中包含一个value初始值为 0 的字段。它声明一个 1x1矩阵来保存第一个条形图上的m单个实例,然后调用将矩阵的第一行复制为数组
。在每个图表条形图上,脚本都会将 1 添加到第一个
数组元素的字段。在这种情况下,矩阵元素的字段也会在每个条形图上增加,因为两个元素都引用同一个对象:myUDTm.row(0)valuerowvalue
//@version=5
indicator("Row with reference types demo")

//@type A custom type that holds a float value.
type myUDT
    float value = 0.0

//@variable A 1x1 matrix of `myUDT` type.
var matrix<myUDT> m = matrix.new<myUDT>(1, 1, myUDT.new())
//@variable A shallow copy of the first row of `m`.
array<myUDT> row = m.row(0)
//@variable The first element of the `row`.
myUDT firstElement = row.get(0)

firstElement.value += 1.0 // Add 1 to the `value` field of `firstElement`. Also affects the element in the matrix.

plot(m.get(0, 0).value, linewidth = 3) // Plot the `value` of the `myUDT` object from the first row and column of `m`.
插入
脚本可以通过matrix.add_row()
和
matrix.add_col()向矩阵添加新行和新列
。这些函数将数组中的值引用插入
到指定row/column索引处的矩阵中。如果id矩阵为空(没有行或列),则array_id调用中的 可以是任意大小。如果指定索引处存在行/列,则矩阵会将现有行/列及其后的所有行/列的索引值增加 1。
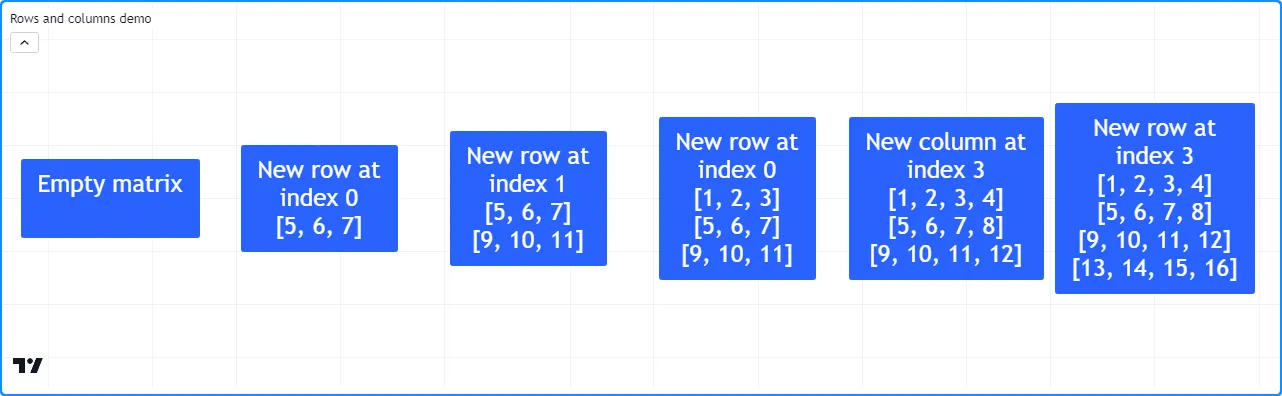
下面的脚本声明了一个空m矩阵,并使用
m.add_row()
和
m.add_col()
方法插入行和列。它首先在第 0 行插入一个包含三个元素的数组,变成
m一个 1x3 矩阵,然后在第 1 行插入另一个数组,将形状更改为 2x3。之后,脚本在第 0 行插入另一个数组,将形状更改为m3x3,并将之前索引为 0 及更高位置的所有行的索引移动。它在最后一列索引处插入另一个数组,将形状更改为 3x4。最后,它在最后一行索引处添加一个包含四个值的数组。
生成的矩阵有四行四列,按升序排列包含 1-16 的值。脚本m使用用户定义的debugLabel()函数显示每行/列插入后的行,以可视化该过程:
//@version=5
indicator("Rows and columns demo")

//@function Displays the rows of a matrix in a label with a note.
//@param    this The matrix to display.
//@param    barIndex The `bar_index` to display the label at.
//@param    bgColor The background color of the label.
//@param    textColor The color of the label's text.
//@param    note The text to display above the rows.
method debugLabel(
     matrix<float> this, int barIndex = bar_index, color bgColor = color.blue,
     color textColor = color.white, string note = ""
 ) =>
    labelText = note + "\n" + str.tostring(this)
    if barstate.ishistory
        label.new(
             barIndex, 0, labelText, color = bgColor, style = label.style_label_center,
             textcolor = textColor, size = size.huge
         )

//Create an empty matrix.
var m = matrix.new<float>()

if bar_index == last_bar_index - 1
    debugLabel(m, bar_index - 30, note = "Empty matrix")

    // Insert an array at row 0. `m` will now have 1 row and 3 columns.
    m.add_row(0, array.from(5, 6, 7))
    debugLabel(m, bar_index - 20, note = "New row at\nindex 0")

    // Insert an array at row 1. `m` will now have 2 rows and 3 columns.
    m.add_row(1, array.from(9, 10, 11))
    debugLabel(m, bar_index - 10, note = "New row at\nindex 1")

    // Insert another array at row 0. `m` will now have 3 rows and 3 columns.
    // The values previously on row 0 will now be on row 1, and the values from row 1 will be on row 2.
    m.add_row(0, array.from(1, 2, 3))
    debugLabel(m, bar_index, note = "New row at\nindex 0")

    // Insert an array at column 3. `m` will now have 3 rows and 4 columns.
    m.add_col(3, array.from(4, 8, 12))
    debugLabel(m, bar_index + 10, note = "New column at\nindex 3")

    // Insert an array at row 3. `m` will now have 4 rows and 4 columns.
    m.add_row(3, array.from(13, 14, 15, 16))
    debugLabel(m, bar_index + 20, note = "New row at\nindex 3")
移除
要从矩阵中删除特定行或列,请使用 matrix.remove_row() 和 matrix.remove_col()。这些函数会删除指定的行/列,并将其后的所有行/列的索引值减少 1。
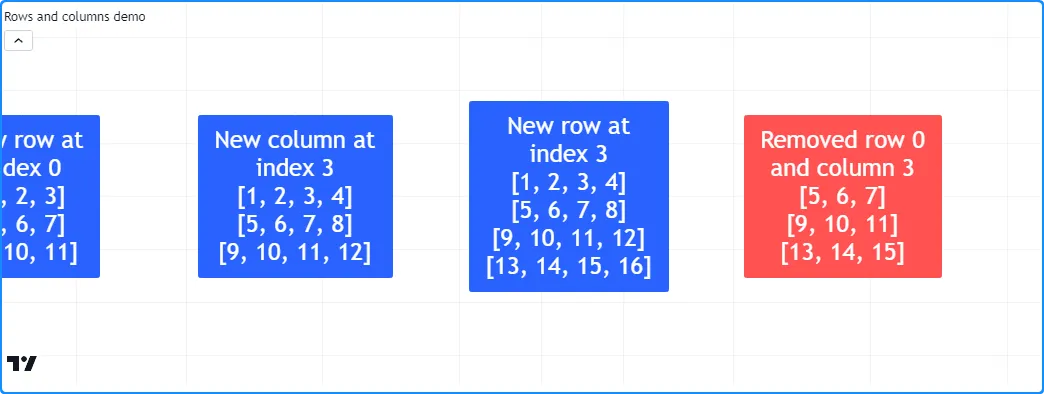
对于此示例,我们从上面的部分将以下代码行添加到我们的“行和列演示”脚本中 :
// Removing example

    // Remove the first row and last column from the matrix. `m` will now have 3 rows and 3 columns.
    m.remove_row(0)
    m.remove_col(3)
    debugLabel(m, bar_index + 30, color.red, note = "Removed row 0\nand column 3")
m此代码使用
m.remove_row()
和
m.remove_col()方法删除矩阵的第一行和最后一列
,并在 处的标签中显示行bar_index + 30。我们可以看到,m执行此块后具有 3x3 形状,并且所有现有行的索引值减少 1:
交换
要交换矩阵的行和列而不改变其维度,请使用
matrix.swap_rows()
和
matrix.swap_columns()row1/column1 。这些函数交换
和索引处元素的位置row2/column2。
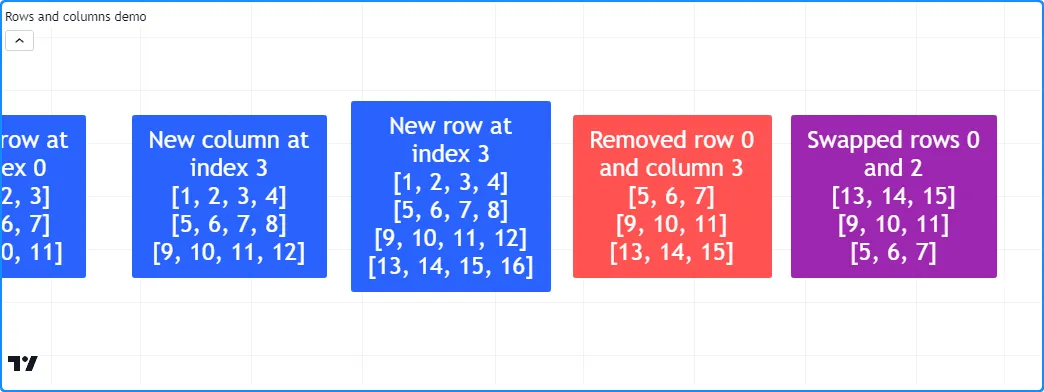
我们将以下几行添加到
前面的示例,交换的第一行和最后一行m并在标签中显示更改bar_index + 40:
// Swapping example

    // Swap the first and last row. `m` retains the same dimensions.
    m.swap_rows(0, 2)
    debugLabel(m, bar_index + 40, color.purple, note = "Swapped rows 0\nand 2")
在新的标签中,我们看到矩阵的行数与以前相同,并且第一行和最后一行交换了位置:
更换
在某些情况下,可能需要完全替换矩阵中的一行或一列。为此,
请在所需位置插入新数组row/column并
删除之前位于该索引处的旧元素。
在下面的代码中,我们定义了一个replaceRow()方法,该方法使用
add_row()values方法在索引处
插入新行row,并使用
remove_row()
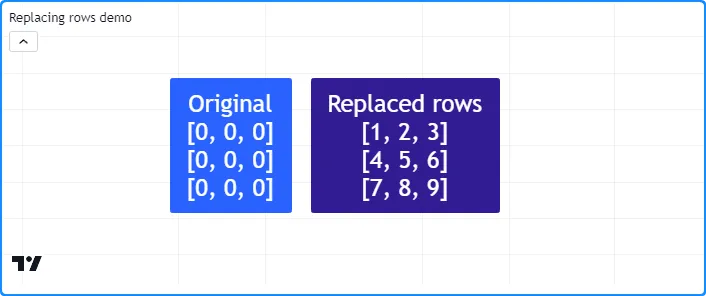
方法删除移动到row + 1索引的旧行。此脚本使用该replaceRow()方法用数字 1-9 填充 3x3 矩阵的行。它在使用自定义方法替换行之前和之后在图表上绘制标签debugLabel():
//@version=5
indicator("Replacing rows demo")

//@function Displays the rows of a matrix in a label with a note.
//@param    this The matrix to display.
//@param    barIndex The `bar_index` to display the label at.
//@param    bgColor The background color of the label.
//@param    textColor The color of the label's text.
//@param    note The text to display above the rows.
method debugLabel(
     matrix<float> this, int barIndex = bar_index, color bgColor = color.blue,
     color textColor = color.white, string note = ""
 ) =>
    labelText = note + "\n" + str.tostring(this)
    if barstate.ishistory
        label.new(
             barIndex, 0, labelText, color = bgColor, style = label.style_label_center,
             textcolor = textColor, size = size.huge
         )

//@function Replaces the `row` of `this` matrix with a new array of `values`.
//@param    row The row index to replace.
//@param    values The array of values to insert.
method replaceRow(matrix<float> this, int row, array<float> values) =>
    this.add_row(row, values) // Inserts a copy of the `values` array at the `row`.
    this.remove_row(row + 1)  // Removes the old elements previously at the `row`.

//@variable A 3x3 matrix.
var matrix<float> m = matrix.new<float>(3, 3, 0.0)

if bar_index == last_bar_index - 1
    m.debugLabel(note = "Original")
    // Replace each row of `m`.
    m.replaceRow(0, array.from(1.0, 2.0, 3.0))
    m.replaceRow(1, array.from(4.0, 5.0, 6.0))
    m.replaceRow(2, array.from(7.0, 8.0, 9.0))
    m.debugLabel(bar_index + 10, note = "Replaced rows")
循环矩阵
`为`
当脚本只需要迭代矩阵中的行/列索引时,最常用的方法是使用
for
循环。例如,此行创建一个循环,row其值从 0 开始,然后逐一增加,直到达到比m矩阵中的行数少 1(即最后一行索引):
for row = 0 to m.rows() - 1
为了迭代m矩阵中的所有索引值,我们可以创建一个
嵌套循环,迭代column每个值的每个索引row
:
for row = 0 to m.rows() - 1
    for column = 0 to m.columns() - 1
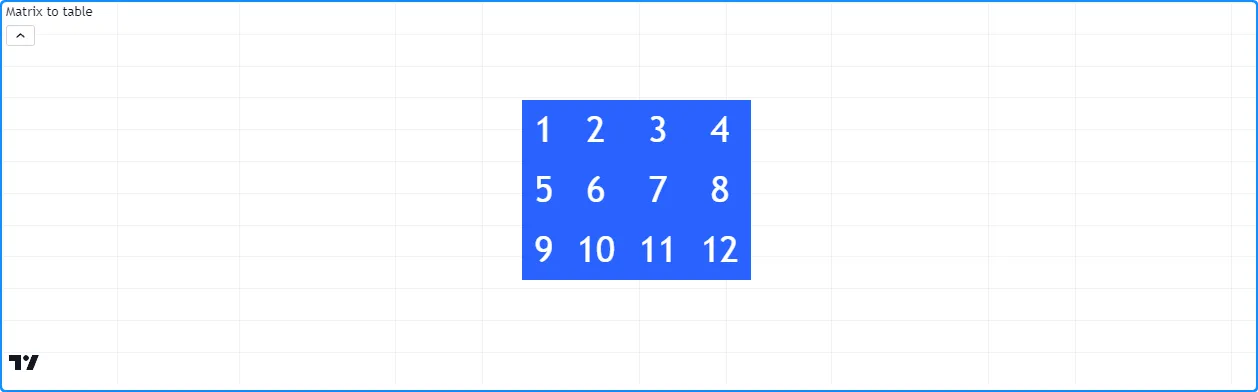
让我们使用这个嵌套结构来创建一个
可视化矩阵元素的方法。在下面的脚本中,我们定义了一个在表toTable()对象
中显示矩阵元素的方法
。它在每个索引上迭代,并在每个索引上迭代。在循环中,它将每个元素转换为
字符串
以显示在相应的表单元格中。rowcolumnrow
在第一个栏上,脚本创建一个空m矩阵,用行填充它,并调用m.toTable()以显示其元素:
//@version=5
indicator("for loop demo", "Matrix to table")

//@function Displays the elements of `this` matrix in a table.
//@param    this The matrix to display.
//@param    position The position of the table on the chart.
//@param    bgColor The background color of the table.
//@param    textColor The color of the text in each cell.
//@param    note A note string to display on the bottom row of the table.
//@returns  A new `table` object with cells corresponding to each element of `this` matrix.
method toTable(
     matrix<float> this, string position = position.middle_center,
     color bgColor = color.blue, color textColor = color.white,
     string note = na
 ) =>
    //@variable The number of rows in `this` matrix.
    int rows = this.rows()
    //@variable The number of columns in `this` matrix.
    int columns = this.columns()
    //@variable A table that displays the elements of `this` matrix with an optional `note` cell.
    table result = table.new(position, columns, rows + 1, bgColor)

    // Iterate over each row index of `this` matrix.
    for row = 0 to rows - 1
        // Iterate over each column index of `this` matrix on each `row`.
        for col = 0 to columns - 1
            //@variable The element from `this` matrix at the `row` and `col` index.
            float element = this.get(row, col)
            // Initialize the corresponding `result` cell with the `element` value.
            result.cell(col, row, str.tostring(element), text_color = textColor, text_size = size.huge)

    // Initialize a merged cell on the bottom row if a `note` is provided.
    if not na(note)
        result.cell(0, rows, note, text_color = textColor, text_size = size.huge)
        result.merge_cells(0, rows, columns - 1, rows)

    result // Return the `result` table.

//@variable A 3x4 matrix of values.
var m = matrix.new<float>()

if bar_index == 0
    // Add rows to `m`.
    m.add_row(0, array.from(1, 2, 3))
    m.add_row(1, array.from(5, 6, 7))
    m.add_row(2, array.from(9, 10, 11))
    // Add a column to `m`.
    m.add_col(3, array.from(4, 8, 12))
    // Display the elements of `m` in a table.
    m.toTable()
`for…in`
当脚本需要迭代并检索矩阵的行时,使用
for…in
结构通常比标准循环更受欢迎for。此结构直接引用矩阵中的行
数组row,使其成为此类用例的更方便的选择。例如,此行创建一个循环,为矩阵中的每一行返回一个数组m
:
for row in m
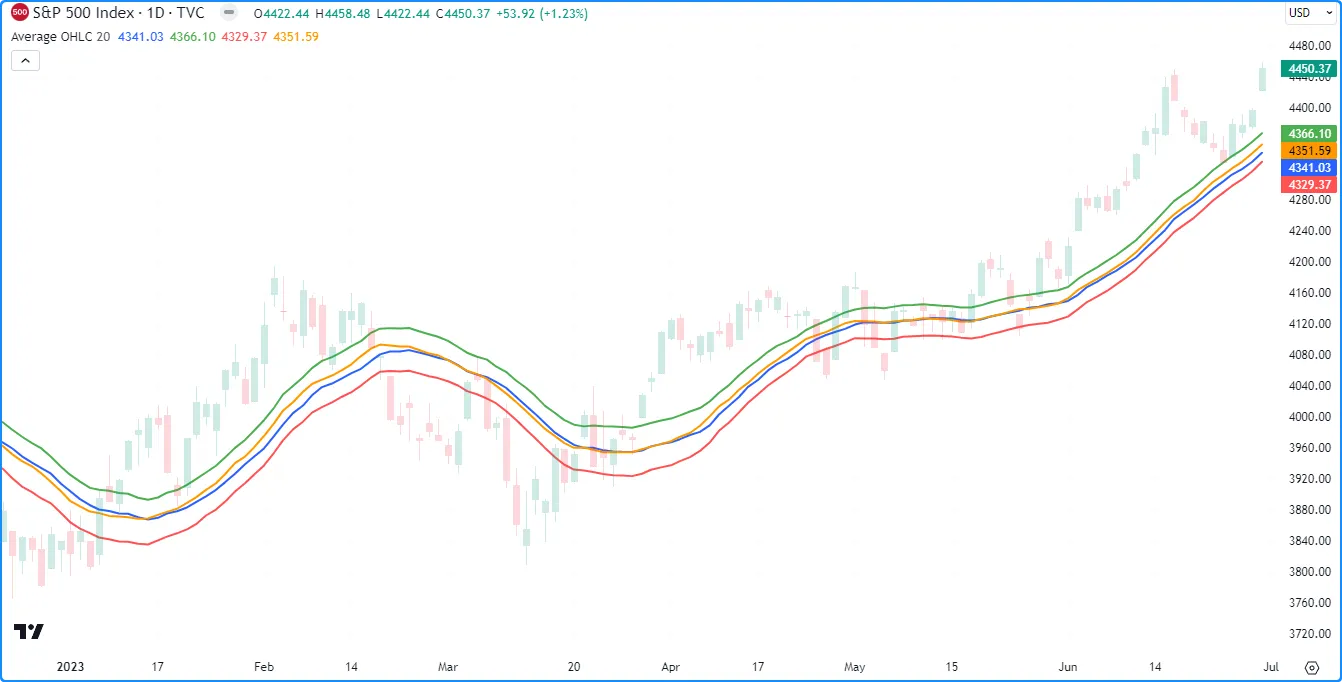
以下指标使用输入计算 OHLC 数据的移动平均值length,并在图表上显示值。自定义
rowWiseAvg()方法使用结构循环遍历矩阵的行,
以生成包含
每个array.avg()for...in的数组
。row
在第一个图表条上,脚本创建一个m具有四行四列的新矩阵length,它通过
每个后续条上的m.add_col()
和
m.remove_col()m.rowWiseAvg()方法将新的 OHLC 数据列排队到该矩阵中。它使用行计算数组averages,然后在图表上绘制元素值:
//@version=5
indicator("for...in loop demo", "Average OHLC", overlay = true)

//@variable The number of terms in the average.
int length = input.int(20, "Length", minval = 1)

//@function Calculates the average of each matrix row.
method rowWiseAvg(matrix<float> this) =>
    //@variable An array with elements corresponding to each row's average.
    array<float> result = array.new<float>()
    // Iterate over each `row` of `this` matrix.
    for row in this
        // Push the average of each `row` into the `result`.
        result.push(row.avg())
    result // Return the resulting array.

//@variable A 4x`length` matrix of values.
var matrix<float> m = matrix.new<float>(4, length)

// Add a new column containing OHLC values to the matrix.
m.add_col(m.columns(), array.from(open, high, low, close))
// Remove the first column.
m.remove_col(0)

//@variable An array containing averages of `open`, `high`, `low`, and `close` over `length` bars.
array<float> averages = m.rowWiseAvg()

plot(averages.get(0), "Average Open",  color.blue,   2)
plot(averages.get(1), "Average High",  color.green,  2)
plot(averages.get(2), "Average Low",   color.red,    2)
plot(averages.get(3), "Average Close", color.orange, 2)
注意:
for...in循环还可以引用每行的索引值。例如,在每次循环迭代中for [i, row] in m创建一个包含 行索引和来自矩阵的i相应数组的元组 。rowm
复制矩阵
浅拷贝
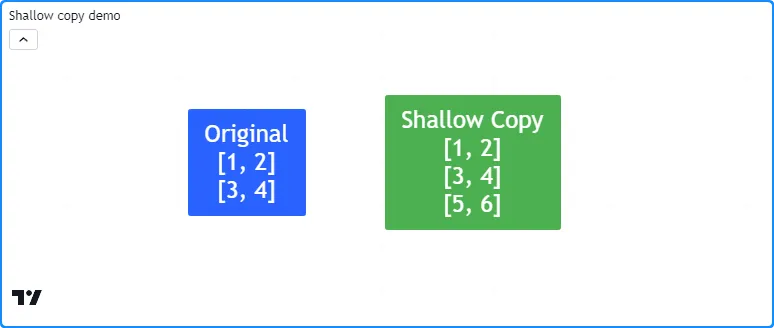
Pine 脚本可以通过 matrix.copy()复制矩阵。此函数返回矩阵的浅表副本,不会影响原始矩阵或其引用的形状。
例如,此脚本将一个新矩阵分配给变量myMatrix并添加两列。它
使用
myMatrix.copy()myCopy方法创建一个新矩阵
,然后添加一个新行。它通过用户定义函数在标签中显示两个矩阵的行:myMatrixdebugLabel()
//@version=5
indicator("Shallow copy demo")

//@function Displays the rows of a matrix in a label with a note.
//@param    this The matrix to display.
//@param    barIndex The `bar_index` to display the label at.
//@param    bgColor The background color of the label.
//@param    textColor The color of the label's text.
//@param    note The text to display above the rows.
method debugLabel(
     matrix<float> this, int barIndex = bar_index, color bgColor = color.blue,
     color textColor = color.white, string note = ""
 ) =>
    labelText = note + "\n" + str.tostring(this)
    if barstate.ishistory
        label.new(
             barIndex, 0, labelText, color = bgColor, style = label.style_label_center,
             textcolor = textColor, size = size.huge
         )

//@variable A 2x2 `float` matrix.
matrix<float> myMatrix = matrix.new<float>()
myMatrix.add_col(0, array.from(1.0, 3.0))
myMatrix.add_col(1, array.from(2.0, 4.0))

//@variable A shallow copy of `myMatrix`.
matrix<float> myCopy = myMatrix.copy()
// Add a row to the last index of `myCopy`.
myCopy.add_row(myCopy.rows(), array.from(5.0, 6.0))

if bar_index == last_bar_index - 1
    // Display the rows of both matrices in separate labels.
    myMatrix.debugLabel(note = "Original")
    myCopy.debugLabel(bar_index + 10, color.green, note = "Shallow Copy")
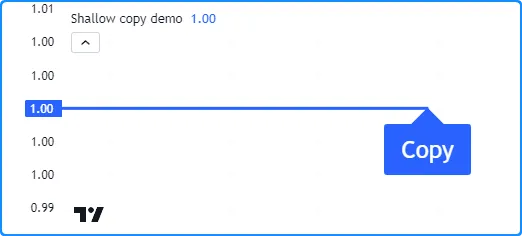
需要注意的是,矩阵浅拷贝中的元素指向与原始矩阵相同的值。当矩阵包含特殊类型(line、 linefill、 box、 polyline、 label、 table或 chart.point)或 用户定义类型时,浅拷贝的元素引用与原始矩阵相同的对象。
此脚本声明一个变量,其初始值为myMatrixa 。然后,它通过
myMatrix.copy()复制到一个变量,
并绘制标签数量。如下所示,
图表上只有一个标签,因为 中的元素引用与 中的元素相同的对象。因此,对 中元素值的更改会影响两个矩阵中的值:newLabelmyMatrixmyCopymyCopymyMatrixmyCopy
//@version=5
indicator("Shallow copy demo")

//@variable Initial value of the original matrix elements.
var label newLabel = label.new(
     bar_index, 1, "Original", color = color.blue, textcolor = color.white, size = size.huge
 )

//@variable A 1x1 matrix containing a new `label` instance.
var matrix<label> myMatrix = matrix.new<label>(1, 1, newLabel)
//@variable A shallow copy of `myMatrix`.
var matrix<label> myCopy = myMatrix.copy()

//@variable The first label from the `myCopy` matrix.
label testLabel = myCopy.get(0, 0)

// Change the `text`, `style`, and `x` values of `testLabel`. Also affects the `newLabel`.
testLabel.set_text("Copy")
testLabel.set_style(label.style_label_up)
testLabel.set_x(bar_index)

// Plot the total number of labels.
plot(label.all.size(), linewidth = 3)
深层复制
通过明确复制矩阵引用的每个对象,可以生成矩阵的深度复制(即,其元素指向原始值的副本的矩阵)。
在这里,我们在之前的脚本中添加了一个deepCopy()用户定义的方法。该方法创建一个新矩阵并使用
嵌套的 for 循环将所有元素分配给原始元素的副本。当脚本调用此方法而不是内置的
copy()时,我们会看到图表上现在有两个标签,并且对标签的任何更改myCopy都不会影响标签myMatrix:

//@version=5
indicator("Deep copy demo")

//@function Returns a deep copy of a label matrix.
method deepCopy(matrix<label> this) =>
    //@variable A deep copy of `this` matrix.
    matrix<label> that = this.copy()
    for row = 0 to that.rows() - 1
        for column = 0 to that.columns() - 1
            // Assign the element at each `row` and `column` of `that` matrix to a copy of the retrieved label.
            that.set(row, column, that.get(row, column).copy())
    that

//@variable Initial value of the original matrix.
var label newLabel = label.new(
     bar_index, 2, "Original", color = color.blue, textcolor = color.white, size = size.huge
 )

//@variable A 1x1 matrix containing a new `label` instance.
var matrix<label> myMatrix = matrix.new<label>(1, 1, newLabel)
//@variable A deep copy of `myMatrix`.
var matrix<label> myCopy = myMatrix.deepCopy()

//@variable The first label from the `myCopy` matrix.
label testLabel = myCopy.get(0, 0)

// Change the `text`, `style`, and `x` values of `testLabel`. Does not affect the `newLabel`.
testLabel.set_text("Copy")
testLabel.set_style(label.style_label_up)
testLabel.set_x(bar_index)

// Change the `x` value of `newLabel`.
newLabel.set_x(bar_index)

// Plot the total number of labels.
plot(label.all.size(), linewidth = 3)
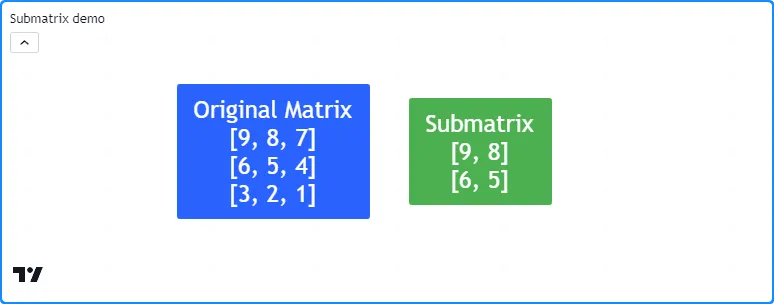
子矩阵
在 Pine 中,子矩阵是
现有矩阵的浅表副本from_row/column,仅包含和to_row/column
参数指定的行和列。本质上,它是矩阵的切片副本。
例如,下面的脚本
通过
m.submatrix()mSub方法从矩阵创建一个矩阵
,然后调用我们的用户定义函数在标签中显示两个矩阵的行:mdebugLabel()
//@version=5
indicator("Submatrix demo")

//@function Displays the rows of a matrix in a label with a note.
//@param    this The matrix to display.
//@param    barIndex The `bar_index` to display the label at.
//@param    bgColor The background color of the label.
//@param    textColor The color of the label's text.
//@param    note The text to display above the rows.
method debugLabel(
     matrix<float> this, int barIndex = bar_index, color bgColor = color.blue,
     color textColor = color.white, string note = ""
 ) =>
    labelText = note + "\n" + str.tostring(this)
    if barstate.ishistory
        label.new(
             barIndex, 0, labelText, color = bgColor, style = label.style_label_center,
             textcolor = textColor, size = size.huge
         )

//@variable A 3x3 matrix of values.
var m = matrix.new<float>()

if bar_index == last_bar_index - 1
    // Add columns to `m`.
    m.add_col(0, array.from(9, 6, 3))
    m.add_col(1, array.from(8, 5, 2))
    m.add_col(2, array.from(7, 4, 1))
    // Display the rows of `m`.
    m.debugLabel(note = "Original Matrix")

    //@variable A 2x2 submatrix of `m` containing the first two rows and columns.
    matrix<float> mSub = m.submatrix(from_row = 0, to_row = 2, from_column = 0, to_column = 2)
    // Display the rows of `mSub`
    debugLabel(mSub, bar_index + 10, bgColor = color.green, note = "Submatrix")
范围和历史
矩阵变量在每个条形上留下历史轨迹,允许脚本使用历史引用运算符 []与先前分配给变量的过去矩阵实例进行交互。此外,脚本可以在函数、 方法和 条件结构 范围内修改分配给全局变量的矩阵 。
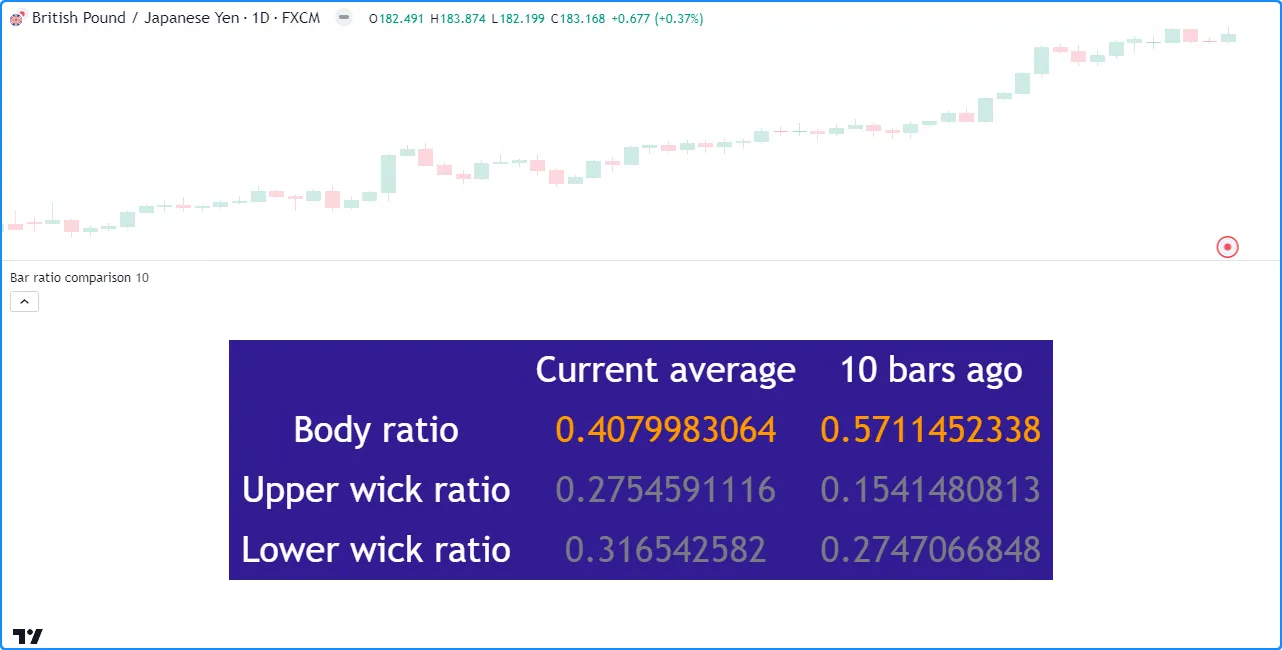
此脚本计算了实体和芯线距离相对于条形图范围的平均比率。它在表格中
length显示数据以及之前条形图的值。用户定义函数将当前和历史比率列添加到,并且该函数引用使用
[]运算符
分配给 的矩阵
来计算平均值矩阵:lengthaddData()globalMatrixcalcAvg()previousglobalMatrix
//@version=5
indicator("Scope and history demo", "Bar ratio comparison")

int length = input.int(10, "Length", 1)

//@variable A global matrix.
matrix<float> globalMatrix = matrix.new<float>()

//@function Calculates the ratio of body range to candle range.
bodyRatio() =>
    math.abs(close - open) / (high - low)

//@function Calculates the ratio of upper wick range to candle range.
upperWickRatio() =>
    (high - math.max(open, close)) / (high - low)

//@function Calculates the ratio of lower wick range to candle range.
lowerWickRatio() =>
    (math.min(open, close) - low) / (high - low)

//@function Adds data to the `globalMatrix`.
addData() =>
    // Add a new column of data at `column` 0.
    globalMatrix.add_col(0, array.from(bodyRatio(), upperWickRatio(), lowerWickRatio()))
    //@variable The column of `globalMatrix` from index 0 `length` bars ago.
    array<float> pastValues = globalMatrix.col(0)[length]
    // Add `pastValues` to the `globalMatrix`, or an array of `na` if `pastValues` is `na`.
    if na(pastValues)
        globalMatrix.add_col(1, array.new<float>(3))
    else
        globalMatrix.add_col(1, pastValues)

//@function Returns the `length`-bar average of matrices assigned to `globalMatrix` on historical bars.
calcAvg() =>
    //@variable The sum historical `globalMatrix` matrices.
    matrix<float> sums = matrix.new<float>(globalMatrix.rows(), globalMatrix.columns(), 0.0)
    for i = 0 to length - 1
        //@variable The `globalMatrix` matrix `i` bars before the current bar.
        matrix<float> previous = globalMatrix[i]
        // Break the loop if `previous` is `na`.
        if na(previous)
            sums.fill(na)
            break
        // Assign the sum of `sums` and `previous` to `sums`.
        sums := matrix.sum(sums, previous)
    // Divide the `sums` matrix by the `length`.
    result = sums.mult(1.0 / length)

// Add data to the `globalMatrix`.
addData()

//@variable The historical average of the `globalMatrix` matrices.
globalAvg = calcAvg()

//@variable A `table` displaying information from the `globalMatrix`.
var table infoTable = table.new(
     position.middle_center, globalMatrix.columns() + 1, globalMatrix.rows() + 1, bgcolor = color.navy
 )

// Define value cells.
for [i, row] in globalAvg
    for [j, value] in row
        color textColor = value > 0.333 ? color.orange : color.gray
        infoTable.cell(j + 1, i + 1, str.tostring(value), text_color = textColor, text_size = size.huge)

// Define header cells.
infoTable.cell(0, 1, "Body ratio", text_color = color.white, text_size = size.huge)
infoTable.cell(0, 2, "Upper wick ratio", text_color = color.white, text_size = size.huge)
infoTable.cell(0, 3, "Lower wick ratio", text_color = color.white, text_size = size.huge)
infoTable.cell(1, 0, "Current average", text_color = color.white, text_size = size.huge)
infoTable.cell(2, 0, str.format("{0} bars ago", length), text_color = color.white, text_size = size.huge)
注意:
addData()和函数calcAvg()没有参数,因为它们直接与 外部作用域中声明的globalMatrix和变量交互。lengthcalcAvg()通过使用matrix.sum()previous添加矩阵 并使用 matrix.mult()将所有元素相乘来计算平均值。我们将在 下面的矩阵计算部分讨论这些和其他专门的函数。1 / length
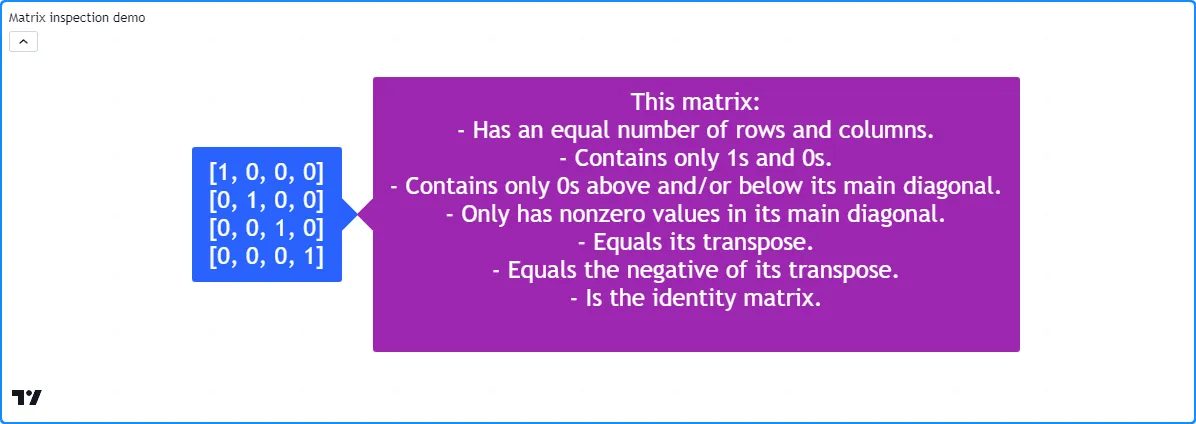
检查矩阵
检查矩阵形状及其元素内的模式的能力至关重要,因为它有助于揭示有关矩阵及其与各种计算和转换的兼容性的重要信息。Pine Script™ 包含几个用于矩阵检查的内置函数,包括 matrix.is_square()、 matrix.is_identity()、 matrix.is_diagonal()、 matrix.is_antidiagonal()、 matrix.is_symmetric()、 matrix.is_antisymmetric()、 matrix.is_triangular()、 matrix.is_stochastic()、 matrix.is_binary()和 matrix.is_zero()。
为了演示这些功能,此示例包含一个自定义
inspect()方法,该方法使用带有函数的条件块matrix.is_*()
来返回有关矩阵的信息。它在图表上的标签中显示m矩阵的字符串表示形式和返回的描述
:m.inspect()
//@version=5
indicator("Matrix inspection demo")

//@function Inspects a matrix using `matrix.is_*()` functions and returns a `string` describing some of its features.
method inspect(matrix<int> this)=>
    //@variable A string describing `this` matrix.
    string result = "This matrix:\n"
    if this.is_square()
        result += "- Has an equal number of rows and columns.\n"
    if this.is_binary()
        result += "- Contains only 1s and 0s.\n"
    if this.is_zero()
        result += "- Is filled with 0s.\n"
    if this.is_triangular()
        result += "- Contains only 0s above and/or below its main diagonal.\n"
    if this.is_diagonal()
        result += "- Only has nonzero values in its main diagonal.\n"
    if this.is_antidiagonal()
        result += "- Only has nonzero values in its main antidiagonal.\n"
    if this.is_symmetric()
        result += "- Equals its transpose.\n"
    if this.is_antisymmetric()
        result += "- Equals the negative of its transpose.\n"
    if this.is_identity()
        result += "- Is the identity matrix.\n"
    result

//@variable A 4x4 identity matrix.
matrix<int> m = matrix.new<int>()

// Add rows to the matrix.
m.add_row(0, array.from(1, 0, 0, 0))
m.add_row(1, array.from(0, 1, 0, 0))
m.add_row(2, array.from(0, 0, 1, 0))
m.add_row(3, array.from(0, 0, 0, 1))

if bar_index == last_bar_index - 1
    // Display the `m` matrix in a blue label.
    label.new(
         bar_index, 0, str.tostring(m), color = color.blue, style = label.style_label_right,
         textcolor = color.white, size = size.huge
     )
    // Display the result of `m.inspect()` in a purple label.
    label.new(
         bar_index, 0, m.inspect(), color = color.purple, style = label.style_label_left,
         textcolor = color.white, size = size.huge
     )
操作矩阵
重塑
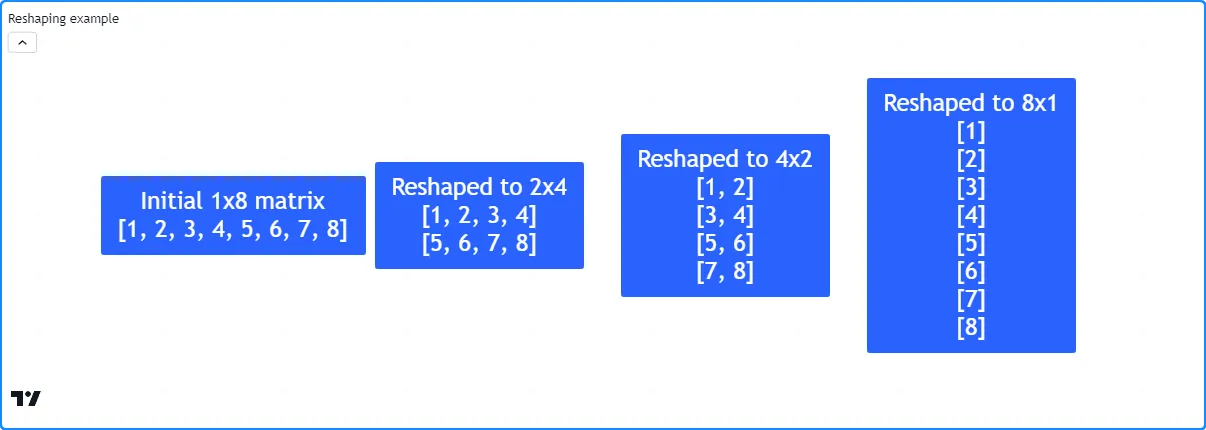
矩阵的形状可以决定其与各种矩阵运算的兼容性。在某些情况下,需要在不影响元素数量或它们引用的值的情况下更改矩阵的维度,这也称为重塑。要在 Pine 中重塑矩阵,请使用 matrix.reshape() 函数。
此示例演示了对矩阵进行多次重塑操作的结果。初始m矩阵的形状为 1x8(一行八列)。通过连续调用
m.reshape()
方法,脚本将形状更改m为 2x4、4x2 和 8x1。它使用自定义方法在图表上的标签中显示每个重塑矩阵
debugLabel():
//@version=5
indicator("Reshaping example")

//@function Displays the rows of a matrix in a label with a note.
//@param    this The matrix to display.
//@param    barIndex The `bar_index` to display the label at.
//@param    bgColor The background color of the label.
//@param    textColor The color of the label's text.
//@param    note The text to display above the rows.
method debugLabel(
     matrix<float> this, int barIndex = bar_index, color bgColor = color.blue,
     color textColor = color.white, string note = ""
 ) =>
    labelText = note + "\n" + str.tostring(this)
    if barstate.ishistory
        label.new(
             barIndex, 0, labelText, color = bgColor, style = label.style_label_center,
             textcolor = textColor, size = size.huge
         )

//@variable A matrix containing the values 1-8.
matrix<int> m = matrix.new<int>()

if bar_index == last_bar_index - 1
    // Add the initial vector of values.
    m.add_row(0, array.from(1, 2, 3, 4, 5, 6, 7, 8))
    m.debugLabel(note = "Initial 1x8 matrix")

    // Reshape. `m` now has 2 rows and 4 columns.
    m.reshape(2, 4)
    m.debugLabel(bar_index + 10, note = "Reshaped to 2x4")

    // Reshape. `m` now has 4 rows and 2 columns.
    m.reshape(4, 2)
    m.debugLabel(bar_index + 20, note = "Reshaped to 4x2")

    // Reshape. `m` now has 8 rows and 1 column.
    m.reshape(8, 1)
    m.debugLabel(bar_index + 30, note = "Reshaped to 8x1")
注意:
- 每次调用时,元素的顺序
m不会改变m.reshape()。 rows重塑矩阵时,和参数的乘积columns必须等于 matrix.elements_count() 值,因为 matrix.reshape() 不能改变矩阵中元素的数量。
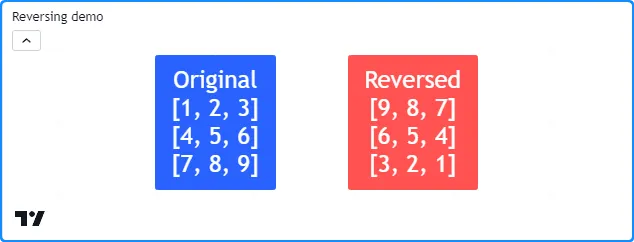
逆转
可以使用matrix.reverse()反转矩阵中所有元素的顺序
。此函数将id第 i 行和第 j 列的 m ×n 矩阵的引用移动到 m - 1 - i 行和 n - 1 - j 列。
例如,此脚本创建一个 3x3 矩阵,其中包含按升序排列的值 1-9,然后使用
reverse()
方法反转其内容。它通过以下方式在图表上的标签中显示矩阵的原始版本和修改版本m.debugLabel():
//@version=5
indicator("Reversing demo")

//@function Displays the rows of a matrix in a label with a note.
//@param    this The matrix to display.
//@param    barIndex The `bar_index` to display the label at.
//@param    bgColor The background color of the label.
//@param    textColor The color of the label's text.
//@param    note The text to display above the rows.
method debugLabel(
     matrix<float> this, int barIndex = bar_index, color bgColor = color.blue,
     color textColor = color.white, string note = ""
 ) =>
    labelText = note + "\n" + str.tostring(this)
    if barstate.ishistory
        label.new(
             barIndex, 0, labelText, color = bgColor, style = label.style_label_center,
             textcolor = textColor, size = size.huge
         )

//@variable A 3x3 matrix.
matrix<float> m = matrix.new<float>()

// Add rows to `m`.
m.add_row(0, array.from(1, 2, 3))
m.add_row(1, array.from(4, 5, 6))
m.add_row(2, array.from(7, 8, 9))

if bar_index == last_bar_index - 1
    // Display the contents of `m`.
    m.debugLabel(note = "Original")
    // Reverse `m`, then display its contents.
    m.reverse()
    m.debugLabel(bar_index + 10, color.red, note = "Reversed")
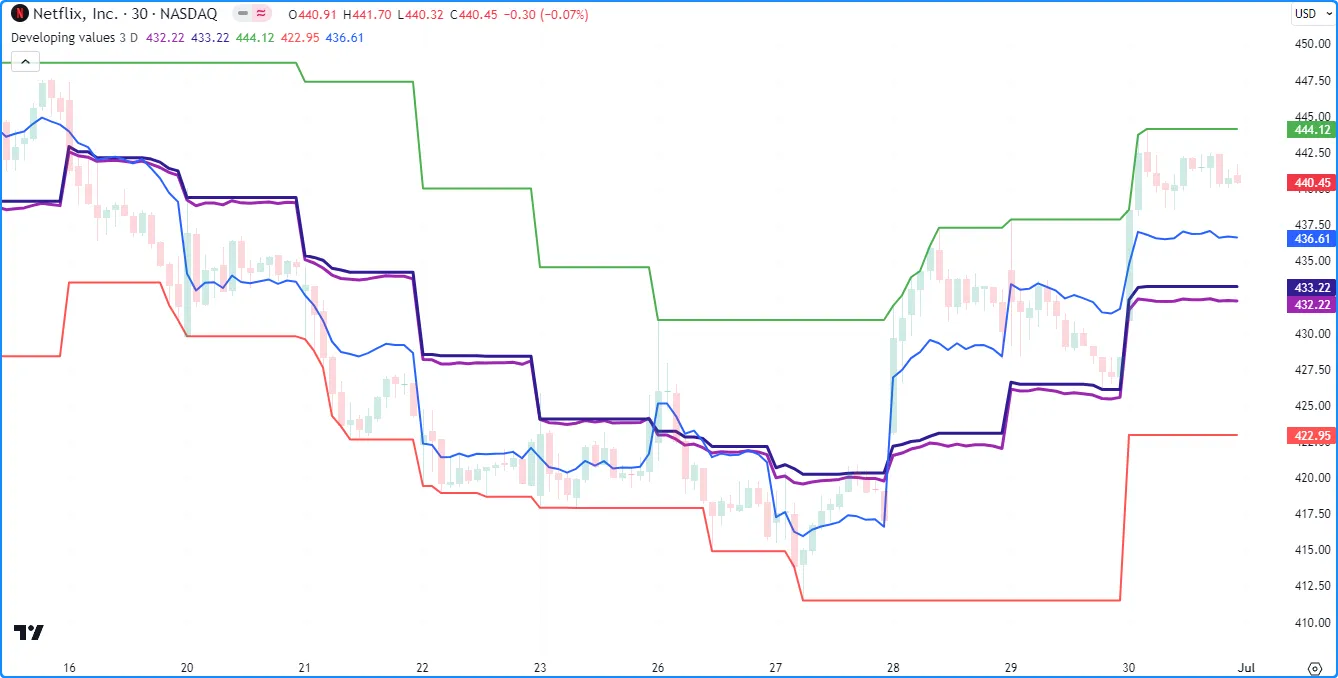
移调
转置矩阵是一种基本操作,它将矩阵中的所有行和列沿其主对角线(行索引等于列索引的所有值的对角线向量)翻转。此过程会生成一个行和列维度反转的新矩阵,称为转置。脚本可以使用matrix.transpose()计算矩阵的转置 。
对于任何 m 行、n 列的矩阵, matrix.transpose()返回的矩阵 将有 n 行和 m 列。矩阵中第 i 行和第 j 列的所有元素都对应于其转置中第 j 行和第 i 列的元素。
此示例声明一个 2x4m矩阵,使用
m.transpose()
方法计算其转置,并使用我们的自定义方法在图表上显示两个矩阵
debugLabel()。如下所示,转置矩阵具有 4x2 形状,转置的行与原始矩阵的列匹配:
![]()
//@version=5
indicator("Element-wise calculations example", "Developing values", overlay = true)

//@variable The number of data points in the averages.
int length = input.int(3, "Length", 1)
//@variable The timeframe of each reset period.
string timeframe = input.timeframe("D", "Reset Timeframe")

//@variable A 4x`length` matrix of OHLC values.
var matrix<float> ohlcData = matrix.new<float>(4, length)

//@variable Is `true` at the start of a new bar at the `timeframe`.
bool queueColumn = timeframe.change(timeframe)

if queueColumn
    // Add new values to the end column of `ohlcData`.
    ohlcData.add_col(length, array.from(open, high, low, close))
    // Remove the oldest column from `ohlcData`.
    ohlcData.remove_col(0)
else
    // Adjust the last element of column 1 for new highs.
    if high > ohlcData.get(1, length - 1)
        ohlcData.set(1, length - 1, high)
    // Adjust the last element of column 2 for new lows.
    if low < ohlcData.get(2, length - 1)
        ohlcData.set(2, length - 1, low)
    // Adjust the last element of column 3 for the new closing price.
    ohlcData.set(3, length - 1, close)

//@variable The `matrix.avg()` of all elements in `ohlcData`.
avgOHLC4 = ohlcData.avg()
//@variable The `matrix.avg()` of all elements in rows 1 and 2, i.e., the average of all `high` and `low` values.
avgHL2   = ohlcData.submatrix(from_row = 1, to_row = 3).avg()
//@variable The `matrix.max()` of all values in `ohlcData`. Equivalent to `ohlcData.row(1).max()`.
maxHigh = ohlcData.max()
//@variable The `array.min()` of all `low` values in `ohlcData`. Equivalent to `ohlcData.min()`.
minLow = ohlcData.row(2).min()
//@variable The `array.avg()` of the last column in `ohlcData`, i.e., the current OHLC4.
ohlc4Value = ohlcData.col(length - 1).avg()

plot(avgOHLC4, "Average OHLC4", color.purple, 2)
plot(avgHL2, "Average HL2", color.navy, 2)
plot(maxHigh, "Max High", color.green)
plot(minLow, "Min Low", color.red)
plot(ohlc4Value, "Current OHLC4", color.blue)
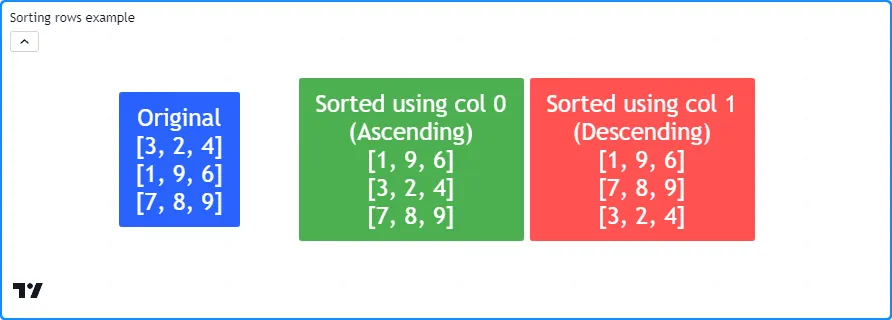
排序
脚本可以通过matrix.sort()对矩阵的内容进行排序
。与对元素进行排序的array.sort()不同
,此函数
根据指定的值按指定的顺序
(默认为order.ascending )组织矩阵中的所有行。ordercolumn
此脚本声明一个 3x3矩阵,根据第一列按升序对副本
m的行进行排序,然后根据第二列按降序对副本的行进行排序。它使用我们的
方法在标签中显示原始矩阵和排序后的副本:m1m2debugLabel()
//@version=5
indicator("Sorting rows example")

//@function Displays the rows of a matrix in a label with a note.
//@param    this The matrix to display.
//@param    barIndex The `bar_index` to display the label at.
//@param    bgColor The background color of the label.
//@param    textColor The color of the label's text.
//@param    note The text to display above the rows.
method debugLabel(
     matrix<float> this, int barIndex = bar_index, color bgColor = color.blue,
     color textColor = color.white, string note = ""
 ) =>
    labelText = note + "\n" + str.tostring(this)
    if barstate.ishistory
        label.new(
             barIndex, 0, labelText, color = bgColor, style = label.style_label_center,
             textcolor = textColor, size = size.huge
         )

//@variable A 3x3 matrix.
matrix<int> m = matrix.new<int>()

if bar_index == last_bar_index - 1
    // Add rows to `m`.
    m.add_row(0, array.from(3, 2, 4))
    m.add_row(1, array.from(1, 9, 6))
    m.add_row(2, array.from(7, 8, 9))
    m.debugLabel(note = "Original")

    // Copy `m` and sort rows in ascending order based on the first column (default).
    matrix<int> m1 = m.copy()
    m1.sort()
    m1.debugLabel(bar_index + 10, color.green, note = "Sorted using col 0\n(Ascending)")

    // Copy `m` and sort rows in descending order based on the second column.
    matrix<int> m2 = m.copy()
    m2.sort(1, order.descending)
    m2.debugLabel(bar_index + 20, color.red, note = "Sorted using col 1\n(Descending)")
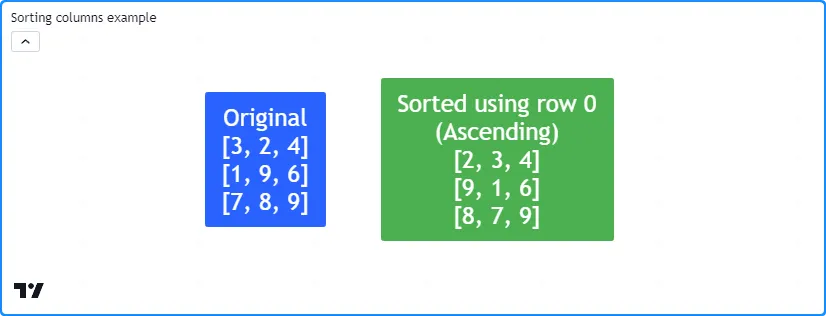
需要注意的是, matrix.sort() 不会对矩阵的列进行排序。但是,可以使用此函数在matrix.transpose()的帮助下对矩阵列进行排序 。
例如,此脚本包含一个sortColumns()方法,该方法使用
sort()方法
根据原始矩阵对应的列对矩阵的转置
进行排序
。该脚本使用此方法根据矩阵第一行的内容对矩阵进行排序:rowm
//@version=5
indicator("Sorting columns example")

//@function Displays the rows of a matrix in a label with a note.
//@param    this The matrix to display.
//@param    barIndex The `bar_index` to display the label at.
//@param    bgColor The background color of the label.
//@param    textColor The color of the label's text.
//@param    note The text to display above the rows.
method debugLabel(
     matrix<float> this, int barIndex = bar_index, color bgColor = color.blue,
     color textColor = color.white, string note = ""
 ) =>
    labelText = note + "\n" + str.tostring(this)
    if barstate.ishistory
        label.new(
             barIndex, 0, labelText, color = bgColor, style = label.style_label_center,
             textcolor = textColor, size = size.huge
         )

//@function Sorts the columns of `this` matrix based on the values in the specified `row`.
method sortColumns(matrix<int> this, int row = 0, bool ascending = true) =>
    //@variable The transpose of `this` matrix.
    matrix<int> thisT = this.transpose()
    //@variable Is `order.ascending` when `ascending` is `true`, `order.descending` otherwise.
    order = ascending ? order.ascending : order.descending
    // Sort the rows of `thisT` using the `row` column.
    thisT.sort(row, order)
    //@variable A copy of `this` matrix with sorted columns.
    result = thisT.transpose()

//@variable A 3x3 matrix.
matrix<int> m = matrix.new<int>()

if bar_index == last_bar_index - 1
    // Add rows to `m`.
    m.add_row(0, array.from(3, 2, 4))
    m.add_row(1, array.from(1, 9, 6))
    m.add_row(2, array.from(7, 8, 9))
    m.debugLabel(note = "Original")

    // Sort the columns of `m` based on the first row and display the result.
    m.sortColumns(0).debugLabel(bar_index + 10, note = "Sorted using row 0\n(Ascending)")
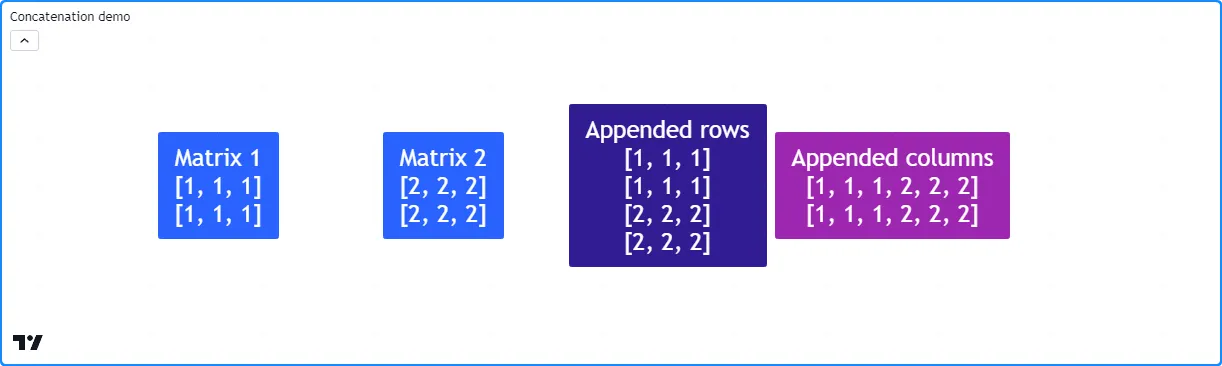
连接
脚本可以使用matrix.concat()连接两个矩阵
。此函数将矩阵的行附加到
具有相同列数的矩阵的末尾。id2id1
要创建一个矩阵,其中元素表示一个矩阵的列附加到另一个矩阵, 请转置两个矩阵, 对转置矩阵 使用matrix.concat() ,然后对 结果使用transpose() 。
例如,此脚本将m2矩阵的行附加到m1
矩阵,并使用矩阵的转置副本m1附加其列。它使用自定义方法在标签中连接它们的行和列后显示和m2矩阵以及结果
debugLabel():
//@version=5
indicator("Concatenation demo")

//@function Displays the rows of a matrix in a label with a note.
//@param    this The matrix to display.
//@param    barIndex The `bar_index` to display the label at.
//@param    bgColor The background color of the label.
//@param    textColor The color of the label's text.
//@param    note The text to display above the rows.
method debugLabel(
     matrix<float> this, int barIndex = bar_index, color bgColor = color.blue,
     color textColor = color.white, string note = ""
 ) =>
    labelText = note + "\n" + str.tostring(this)
    if barstate.ishistory
        label.new(
             barIndex, 0, labelText, color = bgColor, style = label.style_label_center,
             textcolor = textColor, size = size.huge
         )

//@variable A 2x3 matrix filled with 1s.
matrix<int> m1 = matrix.new<int>(2, 3, 1)
//@variable A 2x3 matrix filled with 2s.
matrix<int> m2 = matrix.new<int>(2, 3, 2)

//@variable The transpose of `m1`.
t1 = m1.transpose()
//@variable The transpose of `m2`.
t2 = m2.transpose()

if bar_index == last_bar_index - 1
    // Display the original matrices.
    m1.debugLabel(note = "Matrix 1")
    m2.debugLabel(bar_index + 10, note = "Matrix 2")
    // Append the rows of `m2` to the end of `m1` and display `m1`.
    m1.concat(m2)
    m1.debugLabel(bar_index + 20, color.blue, note = "Appended rows")
    // Append the rows of `t2` to the end of `t1`, then display the transpose of `t1.
    t1.concat(t2)
    t1.transpose().debugLabel(bar_index + 30, color.purple, note = "Appended columns")
矩阵计算
元素级计算
Pine 脚本可以通过matrix.avg()、
matrix.min()、
matrix.max()和
matrix.mode()计算矩阵中所有元素的
平均值、最小值、最大值和
众数。这些函数的操作与其等效函数相同,允许用户使用相同的语法对矩阵、其子矩阵及其
行和列运行元素级计算
。例如,
对具有值 1-9 的 3x3 矩阵和
具有相同九个元素的数组调用的内置函数
都将返回值 5。array.**.avg()
下面的脚本使用*.avg()、*.max()和*.min()方法计算某个时期内 OHLC 数据的发展平均值和极值。
每当时
,它会
在矩阵末尾添加一个包含开盘价、
最高价、
最低价和
收盘价的新列。当 时,脚本使用
get()
和
set()
矩阵方法调整最后一列中的元素,以在当前时期内发展 HLC 值。它使用矩阵、
submatrix()以及
row()
和
col()
数组来计算各个时期内发展中的 OHLC4 和 HL2 平均值
、各个时期内的最高价和最低价以及当前时期发展中的 OHLC4 价格:ohlcDataqueueColumntruefalseohlcDatalengthlength
//@version=5
indicator("Element-wise calculations example", "Developing values", overlay = true)

//@variable The number of data points in the averages.
int length = input.int(3, "Length", 1)
//@variable The timeframe of each reset period.
string timeframe = input.timeframe("D", "Reset Timeframe")

//@variable A 4x`length` matrix of OHLC values.
var matrix<float> ohlcData = matrix.new<float>(4, length)

//@variable Is `true` at the start of a new bar at the `timeframe`.
bool queueColumn = timeframe.change(timeframe)

if queueColumn
    // Add new values to the end column of `ohlcData`.
    ohlcData.add_col(length, array.from(open, high, low, close))
    // Remove the oldest column from `ohlcData`.
    ohlcData.remove_col(0)
else
    // Adjust the last element of column 1 for new highs.
    if high > ohlcData.get(1, length - 1)
        ohlcData.set(1, length - 1, high)
    // Adjust the last element of column 2 for new lows.
    if low < ohlcData.get(2, length - 1)
        ohlcData.set(2, length - 1, low)
    // Adjust the last element of column 3 for the new closing price.
    ohlcData.set(3, length - 1, close)

//@variable The `matrix.avg()` of all elements in `ohlcData`.
avgOHLC4 = ohlcData.avg()
//@variable The `matrix.avg()` of all elements in rows 1 and 2, i.e., the average of all `high` and `low` values.
avgHL2   = ohlcData.submatrix(from_row = 1, to_row = 3).avg()
//@variable The `matrix.max()` of all values in `ohlcData`. Equivalent to `ohlcData.row(1).max()`.
maxHigh = ohlcData.max()
//@variable The `array.min()` of all `low` values in `ohlcData`. Equivalent to `ohlcData.min()`.
minLow = ohlcData.row(2).min()
//@variable The `array.avg()` of the last column in `ohlcData`, i.e., the current OHLC4.
ohlc4Value = ohlcData.col(length - 1).avg()

plot(avgOHLC4, "Average OHLC4", color.purple, 2)
plot(avgHL2, "Average HL2", color.navy, 2)
plot(maxHigh, "Max High", color.green)
plot(minLow, "Min Low", color.red)
plot(ohlc4Value, "Current OHLC4", color.blue)
注意:
- 在这个例子中,我们交替使用了 array.*() 和 matrix.*() 方法来展示它们在语法和行为上的相似性。
- 用户可以通过将 matrix.avg()乘以 matrix.elements_count ()来计算array.sum()的矩阵等效值 。
特殊计算
Pine Script™ 具有多个内置函数,用于执行基本矩阵算术和线性代数运算,包括 matrix.sum()、 matrix.diff()、 matrix.mult()、 matrix.pow()、 matrix.det()、 matrix.inv()、 matrix.pinv()、 matrix.rank()、 matrix.trace()、 matrix.eigenvalues()、 matrix.eigenvectors()和 matrix.kron()。这些函数是高级功能,可促进各种矩阵计算和转换。
下面,我们通过一些基本示例解释一些基本功能。
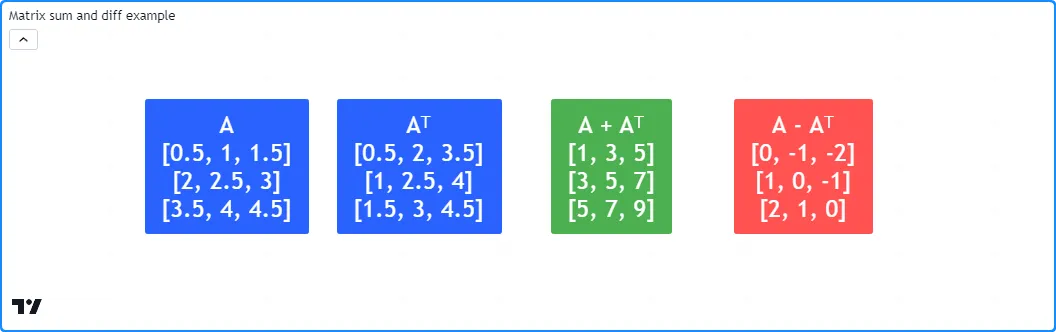
`matrix.sum()` 和`matrix.diff()`
脚本可以使用matrix.sum()
和
matrix.diff()函数对两个具有相同形状的矩阵或一个矩阵和一个标量值执行加法和减法
。这些函数使用矩阵或标量中的值id2对 中的元素进行加法或减法id1。
此脚本演示了 Pine 中矩阵加法和减法的一个简单示例。它创建一个 3x3 矩阵,计算其 转置,然后计算 两个矩阵的matrix.sum() 和 matrix.diff() 。此示例在图表上的标签中显示原始矩阵、其 转置以及由此产生的总和和差矩阵:
//@version=5
indicator("Matrix sum and diff example")

//@function Displays the rows of a matrix in a label with a note.
//@param    this The matrix to display.
//@param    barIndex The `bar_index` to display the label at.
//@param    bgColor The background color of the label.
//@param    textColor The color of the label's text.
//@param    note The text to display above the rows.
method debugLabel(
     matrix<float> this, int barIndex = bar_index, color bgColor = color.blue,
     color textColor = color.white, string note = ""
 ) =>
    labelText = note + "\n" + str.tostring(this)
    if barstate.ishistory
        label.new(
             barIndex, 0, labelText, color = bgColor, style = label.style_label_center,
             textcolor = textColor, size = size.huge
         )

//@variable A 3x3 matrix.
m = matrix.new<float>()

// Add rows to `m`.
m.add_row(0, array.from(0.5, 1.0, 1.5))
m.add_row(1, array.from(2.0, 2.5, 3.0))
m.add_row(2, array.from(3.5, 4.0, 4.5))

if bar_index == last_bar_index - 1
    // Display `m`.
    m.debugLabel(note = "A")
    // Get and display the transpose of `m`.
    matrix<float> t = m.transpose()
    t.debugLabel(bar_index + 10, note = "Aᵀ")
    // Calculate the sum of the two matrices. The resulting matrix is symmetric.
    matrix.sum(m, t).debugLabel(bar_index + 20, color.green, note = "A + Aᵀ")
    // Calculate the difference between the two matrices. The resulting matrix is antisymmetric.
    matrix.diff(m, t).debugLabel(bar_index + 30, color.red, note = "A - Aᵀ")
注意:
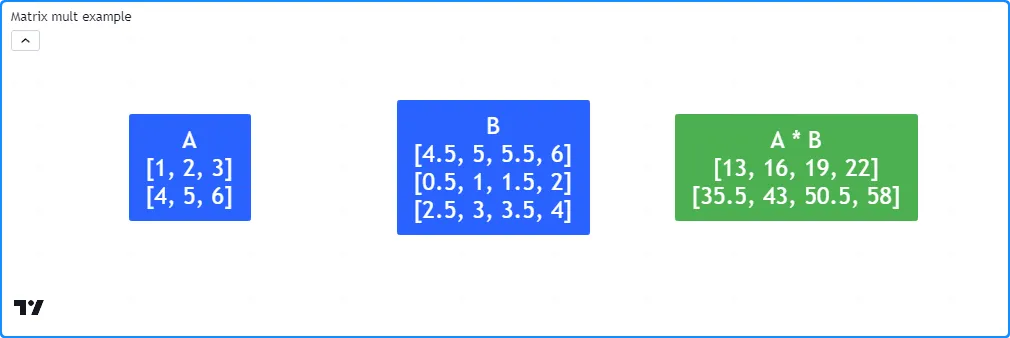
`matrix.mult()`
脚本可以通过 matrix.mult()函数将两个矩阵相乘。此函数还可以将矩阵与数组 或标量值 相乘 。
在将两个矩阵相乘的情况下,与加法和减法不同,矩阵乘法不要求两个矩阵具有相同的形状。但是,第一个矩阵的列数必须等于第二个矩阵的行数。由
matrix.mult()返回的结果矩阵
将包含与 相同的行数id1和列数id2。例如,2x3 矩阵乘以 3x4 矩阵将产生一个具有两行和四列的矩阵,如下所示。结果矩阵中的每个值都是中对应行和 中列的点积:id1id2
//@version=5
indicator("Matrix mult example")

//@function Displays the rows of a matrix in a label with a note.
//@param    this The matrix to display.
//@param    barIndex The `bar_index` to display the label at.
//@param    bgColor The background color of the label.
//@param    textColor The color of the label's text.
//@param    note The text to display above the rows.
method debugLabel(
     matrix<float> this, int barIndex = bar_index, color bgColor = color.blue,
     color textColor = color.white, string note = ""
 ) =>
    labelText = note + "\n" + str.tostring(this)
    if barstate.ishistory
        label.new(
             barIndex, 0, labelText, color = bgColor, style = label.style_label_center,
             textcolor = textColor, size = size.huge
         )

//@variable A 2x3 matrix.
a = matrix.new<float>()
//@variable A 3x4 matrix.
b = matrix.new<float>()

// Add rows to `a`.
a.add_row(0, array.from(1, 2, 3))
a.add_row(1, array.from(4, 5, 6))

// Add rows to `b`.
b.add_row(0, array.from(0.5, 1.0, 1.5, 2.0))
b.add_row(1, array.from(2.5, 3.0, 3.5, 4.0))
b.add_row(0, array.from(4.5, 5.0, 5.5, 6.0))

if bar_index == last_bar_index - 1
    //@variable The result of `a` * `b`.
    matrix<float> ab = a.mult(b)
    // Display `a`, `b`, and `ab` matrices.
    debugLabel(a, note = "A")
    debugLabel(b, bar_index + 10, note = "B")
    debugLabel(ab, bar_index + 20, color.green, note = "A * B")
注意:
- 与标量乘法相反,矩阵乘法是非交换的,即
matrix.mult(a, b)不一定产生与相同的结果matrix.mult(b, a)。在我们的示例中,后者将引发运行时错误,因为中的列数b不等于中的行数a。
当将一个矩阵和一个
数组相乘时,此函数将该操作视为与id1单列矩阵相乘,但它返回一个
数组
,其元素数与 中的行数相同id1。当
matrix.mult()
传递标量作为其id2值时,该函数返回一个新矩阵,其元素是 中的元素id1乘以 的id2值。
`matrix.det()`
行列式是与方阵相关的标量值 , 用于描述方阵的一些特性,即可逆性。如果矩阵有逆 ,则其行列式不为零。否则,矩阵为奇异矩阵(不可逆)。脚本可以通过matrix.det() 计算矩阵的行列式 。
程序员可以使用行列式来检测矩阵之间的相似性、识别满秩和秩亏矩阵、以及求解线性方程组等。
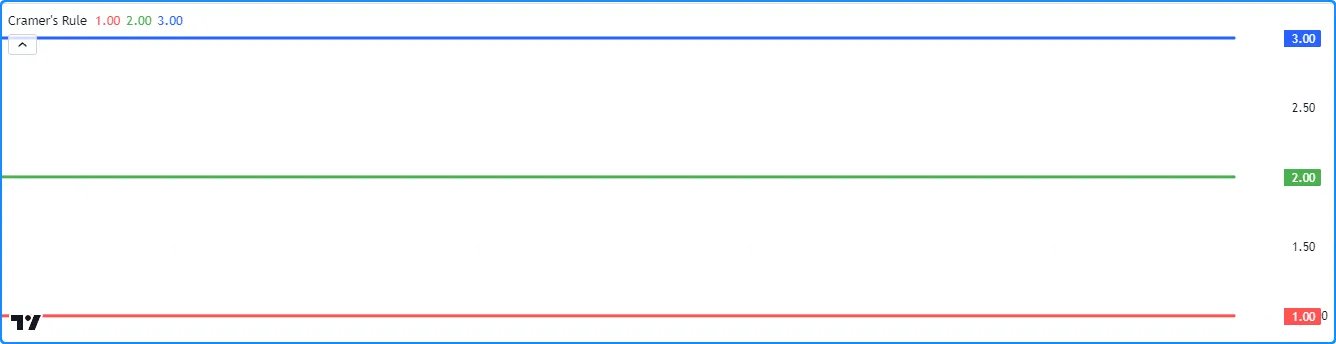
例如,此脚本利用行列式,使用
克莱姆规则求解具有匹配数目的未知值的线性方程组。用户定义solve()函数返回一个
数组
,其中包含系统中每个未知值的解,其中数组的第 n 个元素是系数矩阵的行列式,第 n 列被常数列替换,再除以原始系数的行列式。
m在此脚本中,我们定义了保存这三个方程的系数和常数的矩阵:
3 * x0 + 4 * x1 - 1 * x2 = 85 * x0 - 2 * x1 + 1 * x2 = 42 * x0 - 2 * x1 + 1 * x2 = 1该系统的解是(x0 = 1, x1 = 2, x2 = 3)。脚本通过以下方式计算这些值m并将m.solve()它们绘制在图表上:
//@version=5
indicator("Determinants example", "Cramer's Rule")

//@function Solves a system of linear equations with a matching number of unknowns using Cramer's rule.
//@param    this An augmented matrix containing the coefficients for each unknown and the results of
//          the equations. For example, a row containing the values 2, -1, and 3 represents the equation
//          `2 * x0 + (-1) * x1 = 3`, where `x0` and `x1` are the unknown values in the system.
//@returns  An array containing solutions for each variable in the system.
solve(matrix<float> this) =>
    //@variable The coefficient matrix for the system of equations.
    matrix<float> coefficients = this.submatrix(from_column = 0, to_column = this.columns() - 1)
    //@variable The array of resulting constants for each equation.
    array<float> constants = this.col(this.columns() - 1)
    //@variable An array containing solutions for each unknown in the system.
    array<float> result = array.new<float>()

    //@variable The determinant value of the coefficient matrix.
    float baseDet = coefficients.det()
    matrix<float> modified = na
    for col = 0 to coefficients.columns() - 1
        modified := coefficients.copy()
        modified.add_col(col, constants)
        modified.remove_col(col + 1)

        // Calculate the solution for the column's unknown by dividing the determinant of `modified` by the `baseDet`.
        result.push(modified.det() / baseDet)

    result

//@variable A 3x4 matrix containing coefficients and results for a system of three equations.
m = matrix.new<float>()

// Add rows for the following equations:
// Equation 1: 3 * x0 + 4 * x1 - 1 * x2 = 8
// Equation 2: 5 * x0 - 2 * x1 + 1 * x2 = 4
// Equation 3: 2 * x0 - 2 * x1 + 1 * x2 = 1
m.add_row(0, array.from(3.0, 4.0, -1.0, 8.0))
m.add_row(1, array.from(5.0, -2.0, 1.0, 4.0))
m.add_row(2, array.from(2.0, -2.0, 1.0, 1.0))

//@variable An array of solutions to the unknowns in the system of equations represented by `m`.
solutions = solve(m)

plot(solutions.get(0), "x0", color.red, 3)   // Plots 1.
plot(solutions.get(1), "x1", color.green, 3) // Plots 2.
plot(solutions.get(2), "x2", color.blue, 3)  // Plots 3.
注意:
- 求解方程组对于 回归分析特别有用,例如线性和多项式回归。
- 克莱默法则适用于小型方程组。然而,它在大型系统中计算效率低下。对于此类用例,通常首选其他方法,例如高斯消元法。
`matrix.inv()` 和`matrix.pinv()`
对于任何非奇异 方阵 ,都有一个逆矩阵, 当与原矩阵相乘时,会得到单位 矩阵 。逆矩阵在各种矩阵变换和方程组求解中都很有用。如果存在逆矩阵,脚本可以通过 matrix.inv()函数计算矩阵的逆矩阵 。
对于奇异(不可逆)矩阵,可以通过
matrix.pinv()函数计算广义逆(伪逆),无论矩阵是方阵还是非零矩阵
。请记住,与真逆不同,伪逆与原始矩阵的乘积不一定等于单位矩阵,除非原始矩阵是可逆的。determinant <_PageMatrices_MatrixCalculations_SpecialCalculations_MatrixDet>
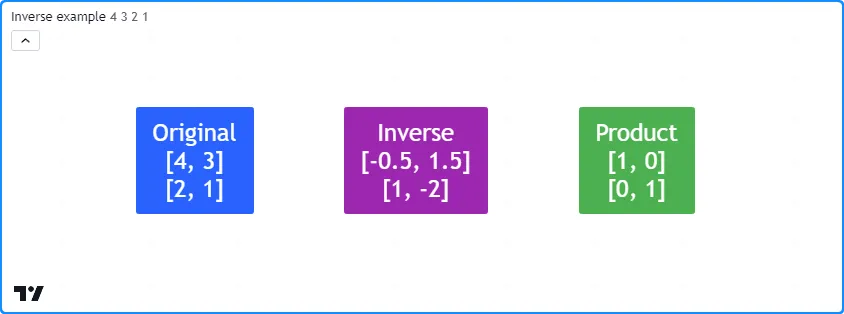
以下示例m根据用户输入形成一个 2x2 矩阵,然后使用
m.inv()
和
m.pinv()
方法计算 的逆或伪逆m。脚本在图表上的标签中显示原始矩阵、其逆或伪逆及其乘积:
//@version=5
indicator("Inverse example")

// Element inputs for the 2x2 matrix.
float r0c0 = input.float(4.0, "Row 0, Col 0")
float r0c1 = input.float(3.0, "Row 0, Col 1")
float r1c0 = input.float(2.0, "Row 1, Col 0")
float r1c1 = input.float(1.0, "Row 1, Col 1")

//@function Displays the rows of a matrix in a label with a note.
//@param    this The matrix to display.
//@param    barIndex The `bar_index` to display the label at.
//@param    bgColor The background color of the label.
//@param    textColor The color of the label's text.
//@param    note The text to display above the rows.
method debugLabel(
     matrix<float> this, int barIndex = bar_index, color bgColor = color.blue,
     color textColor = color.white, string note = ""
 ) =>
    labelText = note + "\n" + str.tostring(this)
    if barstate.ishistory
        label.new(
             barIndex, 0, labelText, color = bgColor, style = label.style_label_center,
             textcolor = textColor, size = size.huge
         )

//@variable A 2x2 matrix of input values.
m = matrix.new<float>()

// Add input values to `m`.
m.add_row(0, array.from(r0c0, r0c1))
m.add_row(1, array.from(r1c0, r1c1))

//@variable Is `true` if `m` is square with a nonzero determinant, indicating invertibility.
bool isInvertible = m.is_square() and m.det()

//@variable The inverse or pseudoinverse of `m`.
mInverse = isInvertible ? m.inv() : m.pinv()

//@variable The product of `m` and `mInverse`. Returns the identity matrix when `isInvertible` is `true`.
matrix<float> product = m.mult(mInverse)

if bar_index == last_bar_index - 1
    // Display `m`, `mInverse`, and their `product`.
    m.debugLabel(note = "Original")
    mInverse.debugLabel(bar_index + 10, color.purple, note = isInvertible ? "Inverse" : "Pseudoinverse")
    product.debugLabel(bar_index + 20, color.green, note = "Product")
注意:
`矩阵.rank()`
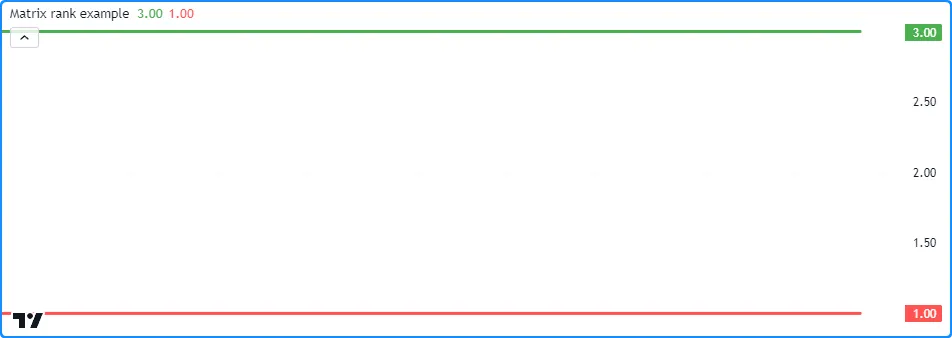
矩阵的秩表示矩阵所含线性独立向量(行或列)的数量。本质上,矩阵秩衡量的是无法用其他向量的线性组合来表示的向量的数量,换句话说,衡量的是包含唯一信息的向量的数量。脚本可以通过matrix.rank() 计算矩阵的秩 。
m1此脚本确定两个 3x3 矩阵(和)中线性独立向量的数量m2,并在单独的窗格中绘制这些值。正如我们在图表上看到的,
m1.rank()
值为 3,因为每个向量都是唯一的。
另一方面,m2.rank()值为 1,因为它只有一个唯一向量:
//@version=5
indicator("Matrix rank example")

//@variable A 3x3 full-rank matrix.
m1 = matrix.new<float>()
//@variable A 3x3 rank-deficient matrix.
m2 = matrix.new<float>()

// Add linearly independent vectors to `m1`.
m1.add_row(0, array.from(3, 2, 3))
m1.add_row(1, array.from(4, 6, 6))
m1.add_row(2, array.from(7, 4, 9))

// Add linearly dependent vectors to `m2`.
m2.add_row(0, array.from(1, 2, 3))
m2.add_row(1, array.from(2, 4, 6))
m2.add_row(2, array.from(3, 6, 9))

// Plot `matrix.rank()` values.
plot(m1.rank(), color = color.green, linewidth = 3)
plot(m2.rank(), color = color.red, linewidth = 3)
注意:
- 矩阵可以具有的最高秩值是其行数和列数中的最小值。具有最大可能秩的矩阵称为满秩矩阵,任何非满秩的矩阵称为秩亏矩阵。
- 满秩方阵的行列式非零 ,且此类矩阵有 逆。相反, 秩亏矩阵的行列式始终为 0。
- 对于每个元素都只包含相同值的矩阵(例如,填充了 0 的矩阵),其秩始终为 0,因为没有任何向量包含唯一信息。对于任何其他具有不同值的矩阵,最小可能秩为 1。
错误处理
除了由于语法不正确而在脚本编译过程中发生的常见编译器错误之外,使用矩阵的脚本在执行过程中还可能引发特定的运行时错误。当脚本引发运行时错误时,它会在脚本标题旁边显示一个红色感叹号。用户可以通过单击此图标来查看错误消息。
在本节中,我们讨论用户在脚本中使用矩阵时可能遇到的运行时错误。
行/列索引(xx)超出范围,行/列大小为(yy)。
当尝试使用包括matrix.get()、 matrix.set()、 matrix.fill()和 matrix.submatrix()在内的函数以及一些与 矩阵的行和列有关的函数访问矩阵维度之外的索引时,就会发生此运行时错误 。
例如,此代码包含两行将产生此运行时错误。
m.set()
方法引用了row不存在的索引 (2)。
m.submatrix()
方法引用了所有列索引,直到to_column - 1。
to_column值为 4 会导致运行时错误,因为引用的最后一个列索引 (3) 在 中不存在m:
//@version=5
indicator("Out of bounds demo")

//@variable A 2x3 matrix with a max row index of 1 and max column index of 2.
matrix<float> m = matrix.new<float>(2, 3, 0.0)

m.set(row = 2, column = 0, value = 1.0)     // The `row` index is out of bounds on this line. The max value is 1.
m.submatrix(from_column = 1, to_column = 4) // The `to_column` index is invalid on this line. The max value is 3.

if bar_index == last_bar_index - 1
    label.new(bar_index, 0, str.tostring(m), color = color.navy, textcolor = color.white, size = size.huge)
用户可以通过确保函数调用不引用大于或等于行数/列数的索引来避免脚本中出现此错误。
数组大小与矩阵的行数/列数不匹配。
使用 matrix.add_row() 和 matrix.add_col() 函数将 行和列插入非空矩阵时,插入数组的大小必须与矩阵维度一致。插入行的大小必须与列数匹配,插入列的大小必须与行数匹配。否则,脚本将引发此运行时错误。例如:
//@version=5
indicator("Invalid array size demo")

// Declare an empty matrix.
m = matrix.new<float>()

m.add_col(0, array.from(1, 2))    // Add a column. Changes the shape of `m` to 2x1.
m.add_col(1, array.from(1, 2, 3)) // Raises a runtime error because `m` has 2 rows, not 3.

plot(m.col(0).get(1))
注意:
- 当为空时,可以插入任意
m大小的行或列数组 ,如第一行所示。m.add_col()
当矩阵的 ID 为“na”时,无法调用矩阵方法。
当矩阵变量被赋值给 时na,这意味着该变量不引用现有对象。因此,不能使用内置matrix.*()函数和方法。例如:
//@version=5
indicator("na matrix methods demo")

//@variable A `matrix` variable assigned to `na`.
matrix<float> m = na

mCopy = m.copy() // Raises a runtime error. You can't copy a matrix that doesn't exist.

if bar_index == last_bar_index - 1
    label.new(bar_index, 0, str.tostring(mCopy), color = color.navy, textcolor = color.white, size = size.huge)
要解决此错误,请m在使用函数之前分配给有效的矩阵实例matrix.*()。
矩阵太大。矩阵的最大大小为 100,000 个元素。
无论矩阵的形状如何,矩阵 ( matrix.elements_count() )中的元素总数都不能超过100,000。例如,此脚本将引发错误,因为它将
1000 行(包含 101 个元素)插入m到矩阵中:
//@version=5
indicator("Matrix too large demo")

var matrix<float> m = matrix.new<float>()

if bar_index == 0
    for i = 1 to 1000
        // This raises an error because the script adds 101 elements on each iteration.
        // 1000 rows * 101 elements per row = 101000 total elements. This is too large.
        m.add_row(m.rows(), array.new<float>(101, i))

plot(m.get(0, 0))
行/列索引必须是 0 <= from_row/column < to_row/column。
当使用带有和
索引matrix.*()的函数时,值必须小于相应的值,最小可能值为 0。否则,脚本将引发运行时错误。from_row/columnto_row/columnfrom_*to_*
例如,此脚本显示尝试
从 4x4矩阵声明一个值为 2 且
值为 2 的子矩阵,这将导致错误:mfrom_rowto_row
//@version=5
indicator("Invalid from_row, to_row demo")

//@variable A 4x4 matrix filled with a random value.
matrix<float> m = matrix.new<float>(4, 4, math.random())

matrix<float> mSub = m.submatrix(from_row = 2, to_row = 2) // Raises an error. `from_row` can't equal `to_row`.

plot(mSub.get(0, 0))
矩阵“id1”和“id2”必须具有相同数量的行和列才能相加。
使用
matrix.sum() 和 matrix.diff()函数时,id1和id2矩阵必须具有相同的行数和列数。尝试添加或减去两个维度不匹配的矩阵将引发错误,如以下代码所示:
//@version=5
indicator("Invalid sum dimensions demo")

//@variable A 2x3 matrix.
matrix<float> m1 = matrix.new<float>(2, 3, 1)
//@variable A 3x4 matrix.
matrix<float> m2 = matrix.new<float>(3, 4, 2)

mSum = matrix.sum(m1, m2) // Raises an error. `m1` and `m2` don't have matching dimensions.

plot(mSum.get(0, 0))
“id1”矩阵的列数必须等于矩阵“id2”的行数(或数组中的元素数) 。
当使用
matrix.mult()将id1矩阵与id2矩阵或数组相乘时, 的
matrix.rows()
或
array.size()
必须id2等于
中的matrix.columns()id1。如果它们不对齐,脚本将引发此错误。
例如,此脚本尝试将两个 2x3 矩阵相乘。虽然 可以将这些矩阵相加,但不能将它们相乘:
//@version=5
indicator("Invalid mult dimensions demo")

//@variable A 2x3 matrix.
matrix<float> m1 = matrix.new<float>(2, 3, 1)
//@variable A 2x3 matrix.
matrix<float> m2 = matrix.new<float>(2, 3, 2)

mSum = matrix.mult(m1, m2) // Raises an error. The number of columns in `m1` and rows in `m2` aren't equal.

plot(mSum.get(0, 0))
对于非方阵,该操作不可用。
一些矩阵运算,包括
matrix.inv()、
matrix.det()、
matrix.eigenvalues()和
matrix.eigenvectors()
仅适用于方阵,即行数和列数相同的矩阵。当尝试在非方阵上执行此类函数时,脚本将引发错误,指出该操作不可用或无法计算矩阵的结果id。例如:
//@version=5
indicator("Non-square demo")

//@variable A 3x5 matrix.
matrix<float> m = matrix.new<float>(3, 5, 1)

plot(m.det()) // Raises a runtime error. You can't calculate the determinant of a 3x5 matrix.