常问问题
在平均足图表上获取实际 OHLC 价格
假设我们有一个 Heikin Ashi 图表(或 Renko、Kagi、PriceBreak 等),并且我们在其上添加了一个 Pine 脚本:
//@version=5
indicator("Visible OHLC", overlay=true)
c = close
plot(c)
您可能会看到变量c是 Heikin Ashi收盘价,它与实际 OHLC 价格不同。因为close内置变量始终是与图表上可见条形图(或蜡烛)相对应的值。
那么,如果当前图表类型是非标准的,我们如何在 Pine Script™ 代码中获取真实的 OHLC 价格?我们应该将request.security函数与ticker.new函数结合使用。这是一个例子:
//@version=5
indicator("Real OHLC", overlay = true)
t = ticker.new(syminfo.prefix, syminfo.ticker)
realC = request.security(t, timeframe.period, close)
plot(realC)
以类似的方式,我们可以获得其他 OHLC 价格:开盘价、最高价和最低价。
在标准图表上获取非标准 OHLC 值
不建议对非标准图表类型(例如 Heikin Ashi 或 Renko)进行回溯测试,因为这些图表上的条形图并不代表您在交易时会遇到的实际价格变动。如果您希望您的策略以实际价格进入和退出,但仍使用基于 Heikin Ashi 的信号,则可以使用相同的方法在常规烛台图上获取 Heikin Ashi 值:
//@version=5
strategy("BarUpDn Strategy", overlay = true, default_qty_type = strategy.percent_of_equity, default_qty_value = 10)
maxIdLossPcntInput = input.float(1, "Max Intraday Loss(%)")
strategy.risk.max_intraday_loss(maxIdLossPcntInput, strategy.percent_of_equity)
needTrade() => close > open and open > close[1] ? 1 : close < open and open < close[1] ? -1 : 0
trade = request.security(ticker.heikinashi(syminfo.tickerid), timeframe.period, needTrade())
if trade == 1
    strategy.entry("BarUp", strategy.long)
if trade == -1
    strategy.entry("BarDn", strategy.short)
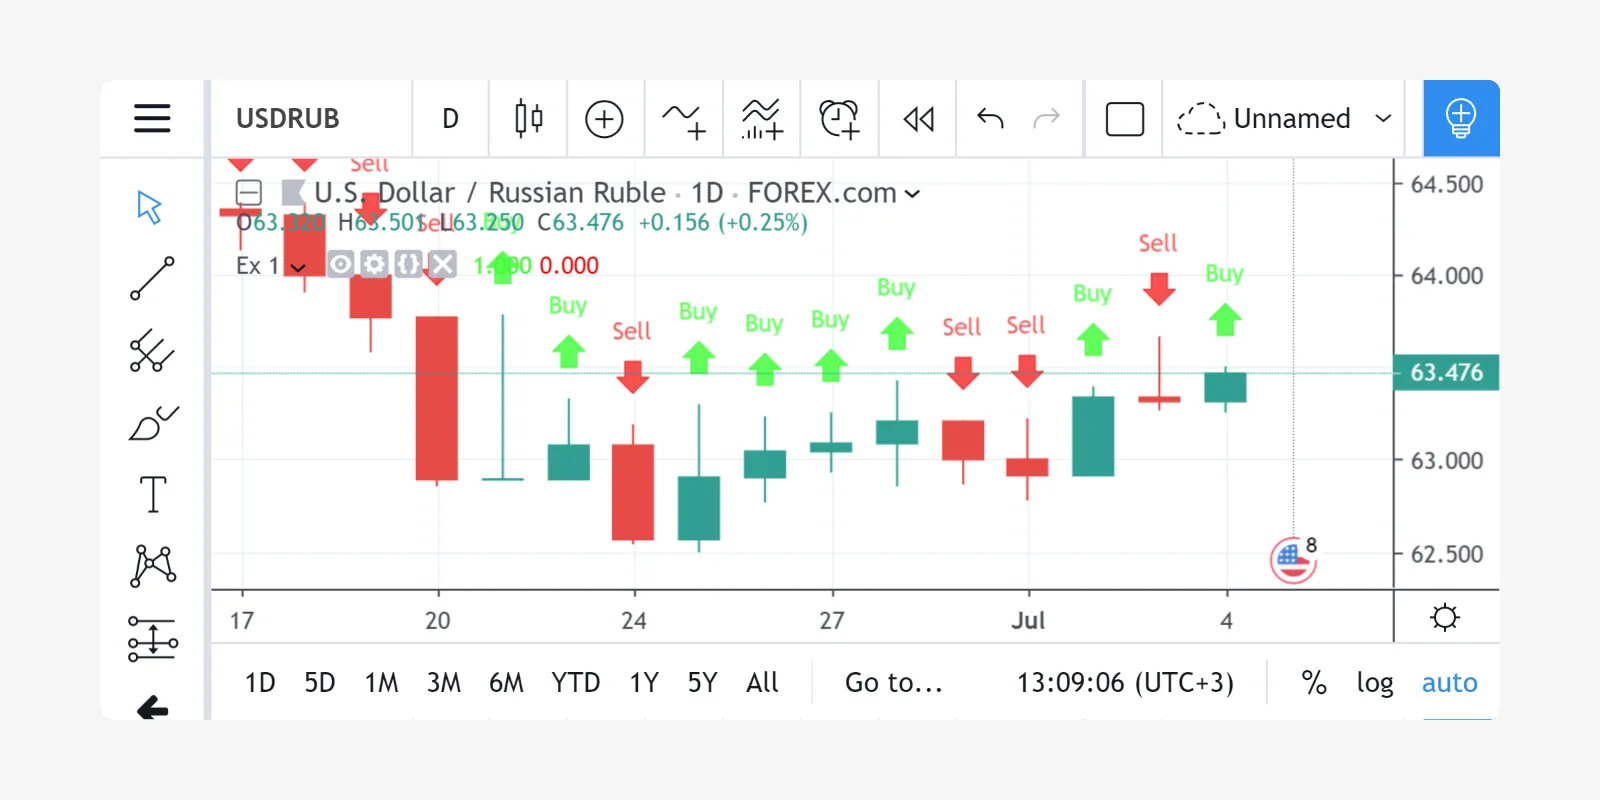
在图表上绘制箭头
您可以将 plotshape 与 styleshape.arrowup和 一起使用shape.arrowdown:
//@version=5
indicator('Ex 1', overlay = true)
condition = close >= open
plotshape(condition, color = color.lime, style = shape.arrowup, text = "Buy")
plotshape(not condition, color = color.red, style = shape.arrowdown, text = "Sell")
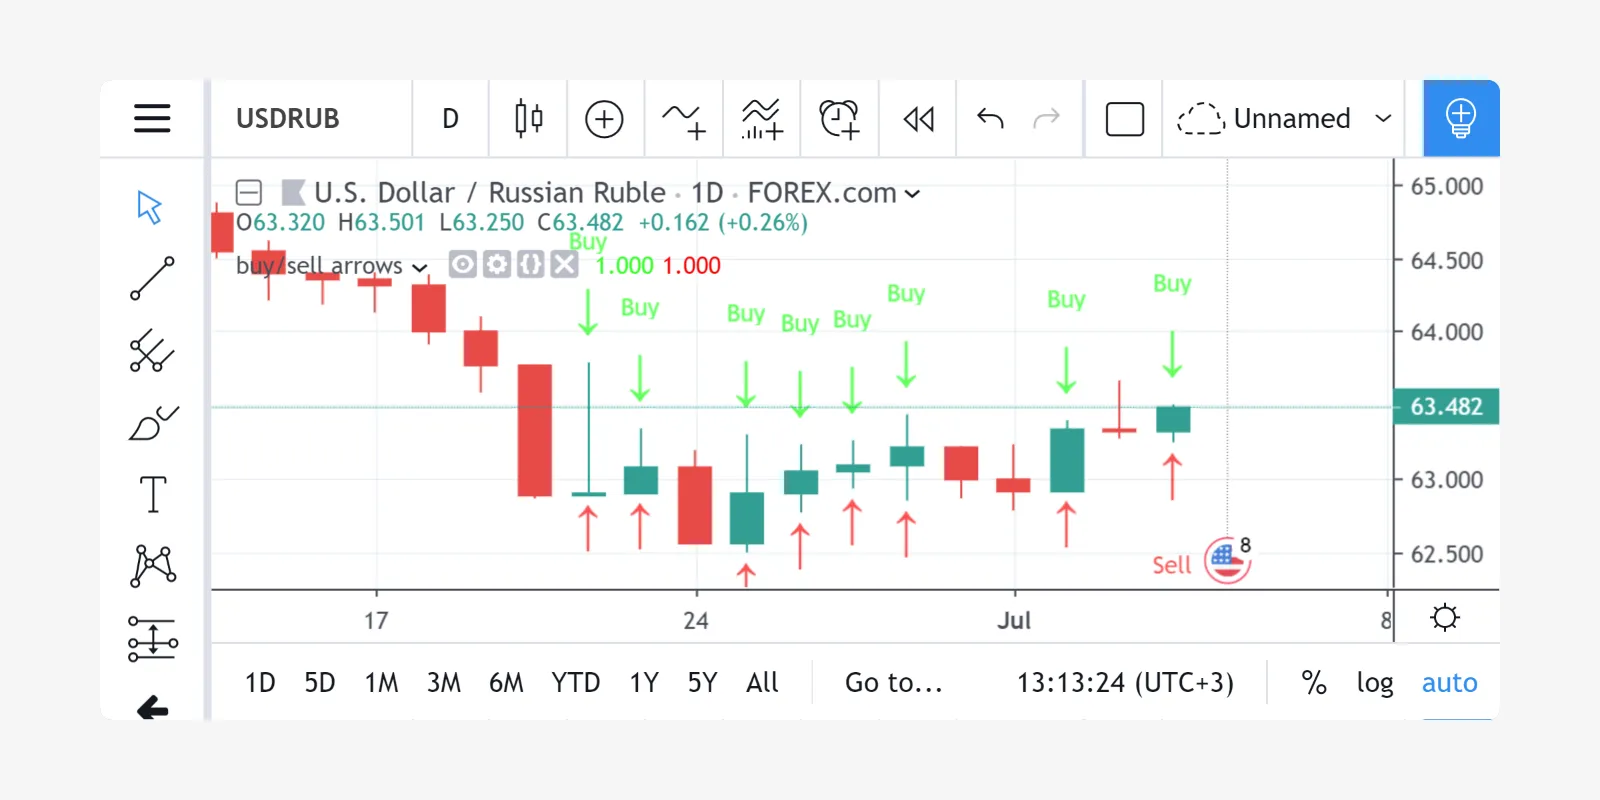
您可以plotchar对任何 Unicode 字符使用该函数:
//@version=5
indicator('buy/sell arrows', overlay = true)
condition = close >= open
plotchar(not condition, char='↓', color = color.lime, text = "Buy")
plotchar(condition, char='↑', location = location.belowbar, color = color.red, text = "Sell")
绘制动态水平线
Pine Script™ 中有此功能hline,但仅限于绘制常数值。下面是一个简单的脚本,其中包含绘制变化线的变通方法:
//@version=5
indicator("Horizontal line", overlay = true)
plot(close[10], trackprice = true, offset = -9999)
// `trackprice = true` plots horizontal line on close[10]
// `offset = -9999` hides the plot
plot(close, color = #FFFFFFFF)  // forces display
根据条件绘制垂直线
//@version=5
indicator("Vertical line", overlay = true, scale = scale.none)
// scale.none means do not resize the chart to fit this plot
// if the bar being evaluated is the last baron the chart (the most recent bar), then cond is true
cond = barstate.islast
// when cond is true, plot a histogram with a line with height value of 100,000,000,000,000,000,000.00
// (10 to the power of 20)
// when cond is false, plot no numeric value (nothing is plotted)
// use the style of histogram, a vertical bar
plot(cond ? 10e20 : na, style = plot.style_histogram)
访问先前的值
//@version=5
//...
s = 0.0
s := nz(s[1]) // Accessing previous values
if (condition)
    s := s + 1
创下 5 天新高
从当前柱线回溯 5 天,找到最高柱线,在当前柱线上方的该价格水平绘制一个星形角色
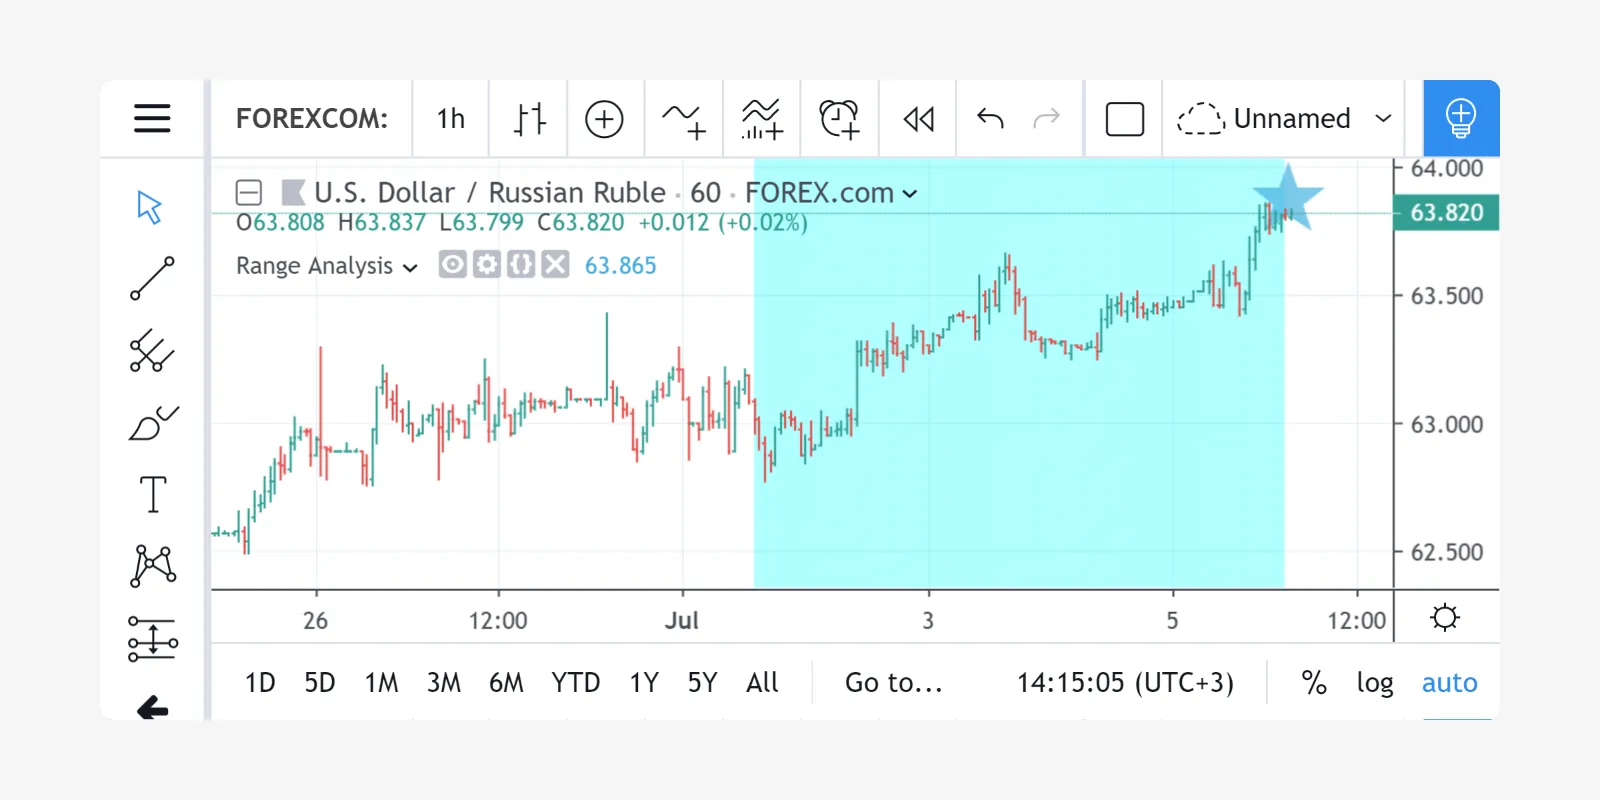
//@version=5
indicator("High of last 5 days", overlay = true)

// Milliseconds in 5 days: millisecs * secs * mins * hours * days
MS_IN_5DAYS = 1000 * 60 * 60 * 24 * 5

// The range check begins 5 days from the current time.
leftBorder = timenow - time < MS_IN_5DAYS
// The range ends on the last bar of the chart.
rightBorder = barstate.islast

// ————— Keep track of highest `high` during the range.
// Intialize `maxHi` with `var` on bar zero only.
// This way, its value is preserved, bar to bar.
var float maxHi = na
if leftBorder
    if not leftBorder[1]
        // Range's first bar.
        maxHi := high
    else if not rightBorder
        // On other bars in the range, track highest `high`.
        maxHi := math.max(maxHi, high)

// Plot level of the highest `high` on the last bar.
plotchar(rightBorder ? maxHi : na, "Level", "—", location.absolute, size = size.normal)
// When in range, color the background.
bgcolor(leftBorder and not rightBorder ? color.new(color.aqua, 70) : na)
计算数据集中的条形图数量
获取已加载数据集中所有条形图的数量。可能有助于根据条形图数量计算灵活的回顾期。
//@version=5
indicator("Bar Count", overlay = true, scale = scale.none)
plot(bar_index + 1, style = plot.style_histogram)
枚举一天中的条形图
//@version=5
indicator("My Script", overlay = true, scale = scale.none)

isNewDay() =>
    d = dayofweek
    na(d[1]) or d != d[1]

plot(ta.barssince(isNewDay()), style = plot.style_cross)
查找整个数据集的最高值和最低值
//@version=5
indicator("", "", true)

allTimetHi(source) =>
    var atHi = source
    atHi := math.max(atHi, source)

allTimetLo(source) =>
    var atLo = source
    atLo := math.min(atLo, source)

plot(allTimetHi(close), "ATH", color.green)
plot(allTimetLo(close), "ATL", color.red)
查询最后一个非 na值
您可以使用以下脚本来避免系列中的间隙:
//@version=5
indicator("")
series = close >= open ? close : na
vw = fixnan(series)
plot(series, style = plot.style_linebr, color = color.red)  // series has na values
plot(vw)  // all na values are replaced with the last non-empty value